
In my fellowship project, I am exploring methods computers can use to understand narrative relationships between personal images. I wrote a good deal about how I'm approaching the project in my first post, but I didn't talk much about the "kit of parts" I am building it with. Today, I'll rundown some of the tools that I'm using to develop exploratory prototypes.
The import process
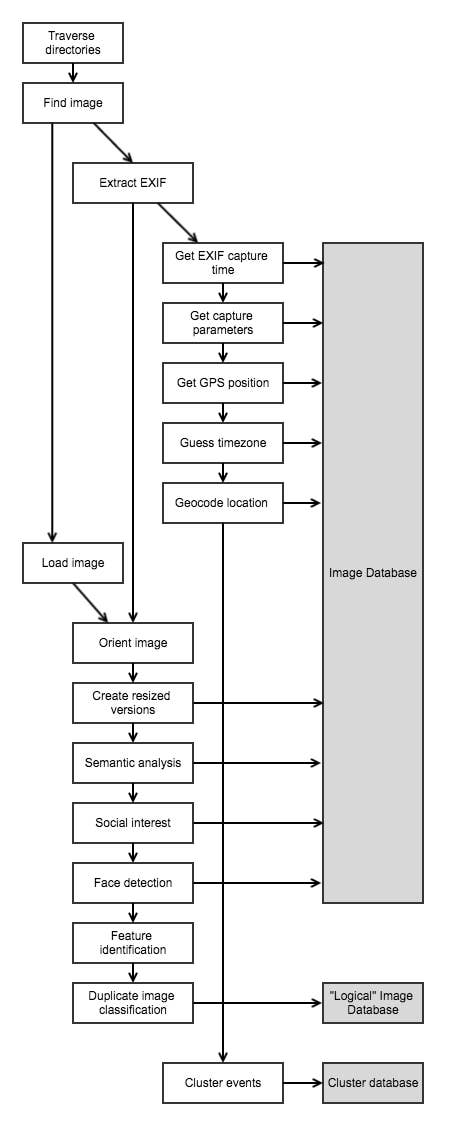
Before I could start developing and testing a new user interface, I needed some basic tools for importing images, extracting data, and organizing it all. In some ways, the pipeline I have assembled replicates the functionality of proprietary software like Apple Photos and Google Photos, but with open source tools that can be shared and further built upon.
Capturing metadata
Organizing images begins by finding the files on disk, whether they are images on a computer, digital camera, or smartphone. Then, by reading Exif data with Python Image Library (PIL), I extract the capture time, exposure parameters, and GPS position.
There are some oddities even with this simple metadata. For example, even though smartphone cameras are aware of the user’s time zone, this data is simply not saved with the image. Instead, I must use the photo’s GPS coordinates and the pytz library to guess at the user’s timezone.
I also use the Google Maps API to convert the GPS coordinates to human readable addresses, a process known as reverse geocoding. As each piece of a metadata is extracted from the image, it is stored in the prototype application’s database.

Processing images
Once I’ve organized the metadata for each image, work begins with the images themselves. The first wrinkle to be ironed involves the orientation of the image. The data in photographs are almost always stored in the same order: the top left corner of the photo is the top left corner of the camera. But if the camera was rotated, the orientation will also be stored in Exif, and the display software will turn the image right-side up. Inconsistency between pixel order and display orientation can make certain parts of development difficult, but Wand, a Python library with bindings to ImageMagick, does a nice job of rotating the image data itself to the correct orientation.
I also generate several sizes of the image, ranging from tiny thumbnails to web resolution, and store the locations of these resized images in the database. This is essential for displaying images in the app, as the full resolution files are unnecessarily large.
At this time, I could also perform any automated contrast, exposure, or sharpening enhancement, or to allow the user to apply filtering or image style adjustments. While I am not currently doing any of this in my demo application, PIL, Wand, and even general matrix manipulation libraries such as NumPy make Python a versatile and appropriate choice for implementing this functionality. If you'd like to learn more, this tutorial on creating Instagram filters in 15 lines of Python is a nice clear walkthrough using NumPy to add Instagram style filters to an image.
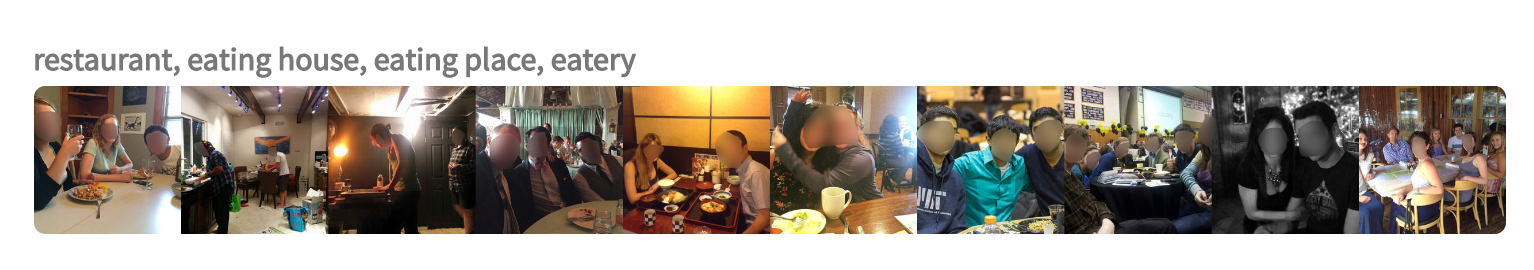
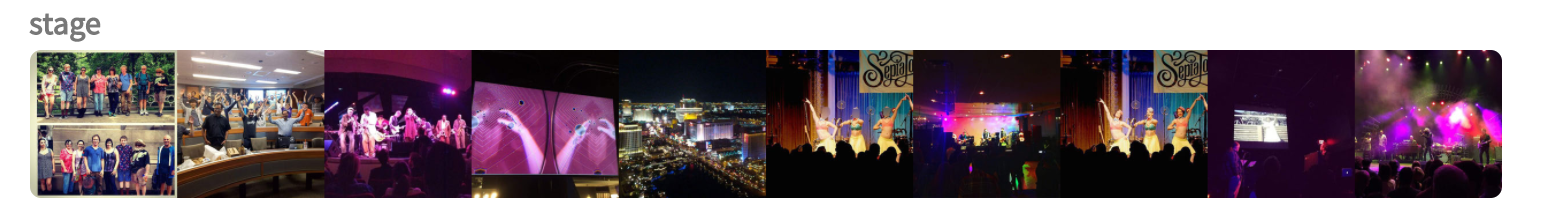
Understanding images
The final and most technically interesting part of the importing process is asking a computer to understand the content of an image. Tremendous advances have been made in the last few years, and this difficult challenge now more accessible than ever. Google open-sourced Inception v3, one of the best performing image classification algorithms. Non-Google alternatives, such as VGG16 are also readily obtainable, for a variety of deep learning frameworks, including TensorFlow and Caffe. In my prototype, I use Inception and save the label probabilities into the image database.
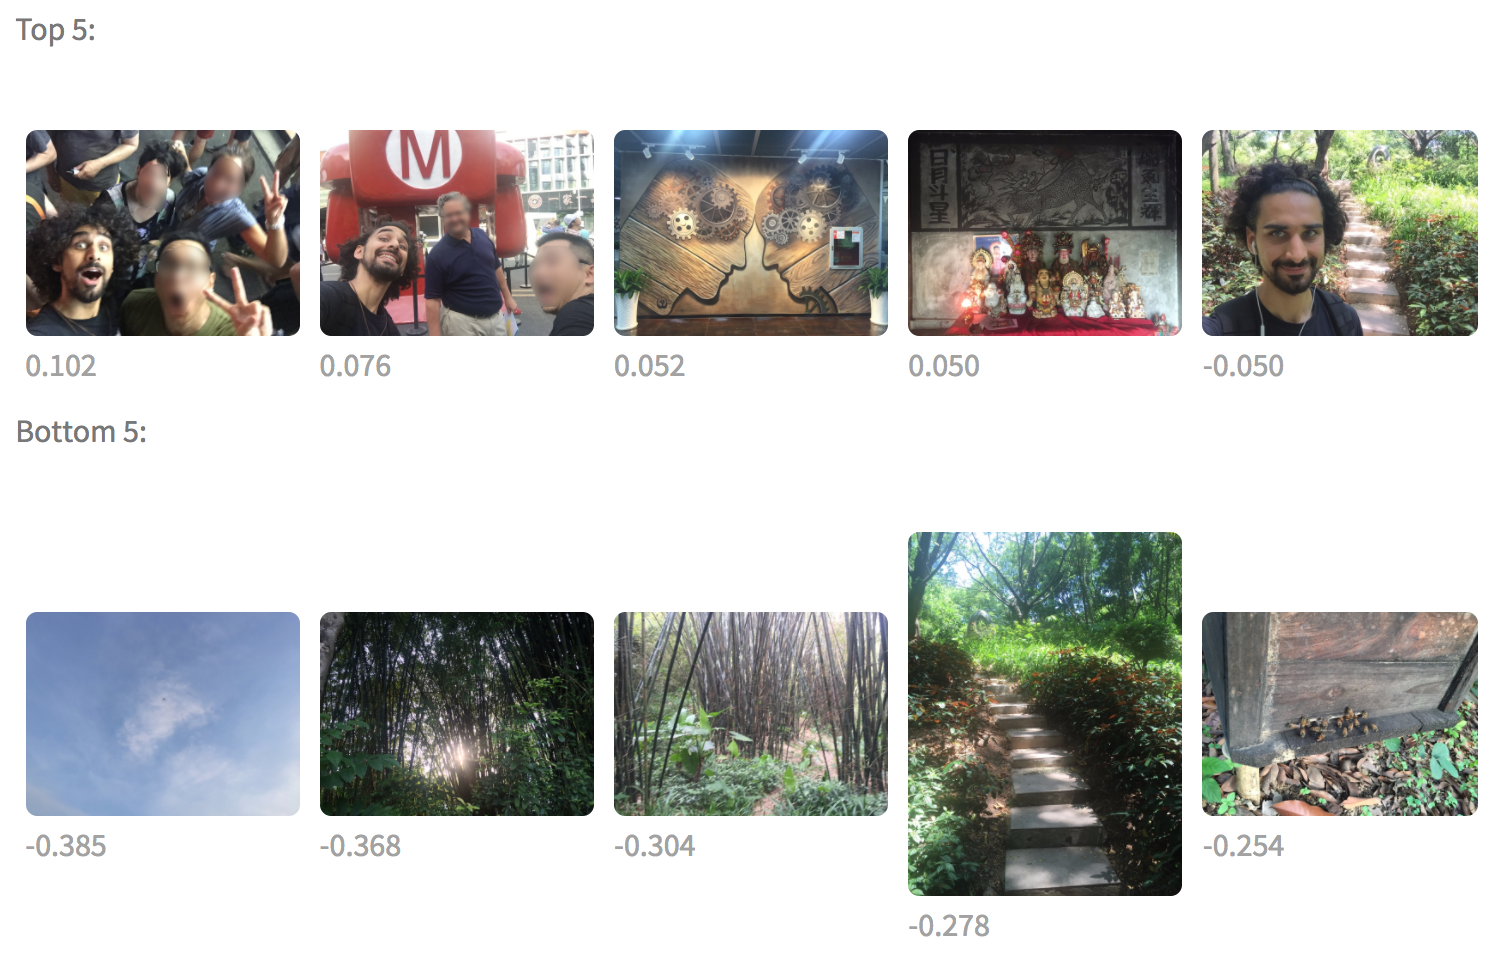
The “hidden layers” of these classification networks also contain information that may be useful for evaluating other properties of the photograph. I've been experimenting with generating measures of “interestingness” using these hidden layers since before I joined the Open Lab. The results of my earlier experimentation suggest that while my method isn't perfect, the interestingness factor is worth evaluating. (If you're really interested in how I tackled generating an interestingness factor, I wrote quite a bit about it on my blog.)
The identities of individual people in a snapshot are of course quite important to the story being told. There are now open source face detection and recognition tools. Face detection is the simple process of identifying the presence of any face, often along with the location of key facial landmarks such as the eyes, nose, and corners of the mouth. Face recognition finds images that appear to show the same person. Recognition is frequently done by dimensionality reduction, where a compressed, “fingerprint” of a face is generated. Then, this vector can be compared directly with other faces. In my prototype, I am using a pre-trained dlib face detection model to detect faces, and the OpenFace neural network to create a 128-dimensional description vector of each face.
One final step before the database of processed, categorized, and labeled images is ready for display in a web application is to locate and group “near-duplicate” images. Many users take nearly the exactly same image several times in a row -- in case one exposure was blurry, someone blinked, or just out of habit. By detecting and grouping near-duplicates, we can present a cleaner view to the user. However, because these images are not exactly the same, simple comparison methods, such as comparing the pixel values directly, fail. I started exploring two less naive duplicate detection methods, histogram comparison and wavelet decomposition, to some success.
However, I have found that the most successful method of identifying near duplicate images is image feature identification. This is the same method by which a panoramic photo might be generated -- finding prominent objects and edges (“features”) between photos and attempting to match them up. If enough features match between two images, they are likely to be duplicates. In my prototype application, I am using OpenCV’s implementation of the SURF (Speeded up robust features) feature detector and a FLANN (Fast Library for Approximate Nearest Neighbors) matcher to find near-duplicates. Suspected duplicate images are grouped into a new database of “logical” images, which can be used directly by the prototype application.
Grouping images into event clusters
Other methods of organizing images will be necessary to begin creating narratives. For example, in addition to finding faces in images, I plan to develop a database of people that those faces correspond to. I’m also experimenting with algorithms to cluster photos by “event” -- bundling photos taken in roughly the same geographic region at about the same time into “event clusters.” Each cluster forms a kind of proto-story -- a series of photos documenting some experience that can be further described, shaped, and shared.
By thinking about photos as existing in a three-dimensional space, where two dimensions are the geographic coordinates, and a third dimension represents time, standard geometric clustering algorithms (a kind of unsupervised learning) can identify possible event clusters. I use scikit-learn, a Python machine learning and statistical analysis library, to cluster images.
There are many tradeoffs during the clustering process. How should the scale of time be related to the geographical scale? How many clusters should there be? How much of a pause between photos indicates a new cluster? Is a pause at night more important than a pause during the day?
To explore possible answers to these questions, I built a tool that allowed these clustering parameters to be adjusted and visualized in real time.
This allowed me to find several possible sets of parameters that provide a cluster results of the size and shape that I had been envisioning. In reality however, no single answer will be sufficient for all users. Not all stories are the same size, and users will need to be able to merge and split clusters.
While the clustering exploration tool isn’t suitable as a real user interface, I hope that by understanding and visualizing the parameter space of clustering algorithms, I can create an interface that allows the size of stories to be adjusted in a straightforward and intelligent way.
In my next toolkit post, I will talk about the development of the prototype web application, visualizing images geographically with mapping toolkits, and user interface concepts.

Open Lab for Journalism, Technology, and the Arts is a workshop in BuzzFeed’s San Francisco bureau. We offer fellowships to artists and programmers and storytellers to spend a year making new work in a collaborative environment. Read more about the lab or sign up for our newsletter.