Making Sense of It All

Results and Findings

Analyzing Quantitative Data

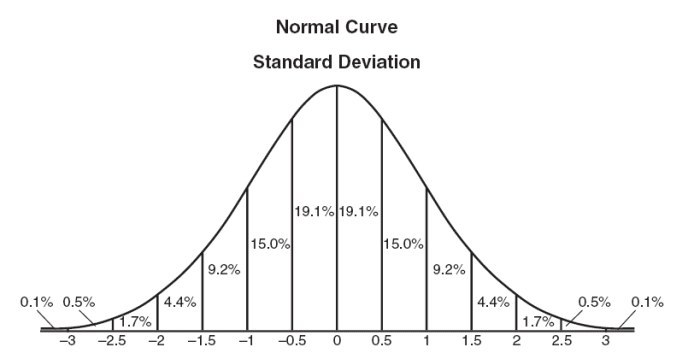
The amount by which people are either taller or shorter than the average is referred to a standard deviation (aka, σ, SD, or s).
Because they deviate from the standard height. Get it?
So the 15.0% of people who are only slightly shorter than average are less than one standard deviation (-.5SD) away from the mean value, and the .01% of people who tower over everyone else are 3 standard deviations (3SD) away from the mean value.

Now, there are many, many types of statistical analysis.
Too many to go through here, but we can talk about a few big ones.
ANOVA analysis, commonly used in the social sciences, analyzes the differences between the means of various groups.
The results section for the essay "Relationship Between Leadership Orientation, Group Performance, and Satisfaction" uses ANOVA analysis (go to Blackboard > readings > Example Results/Findings Sections > Results section from undergraduate essay on "Relationship Between Leadership Orientation, Group Performance, and Satisfaction").
You might use this test if, for example, you want to find out which therapy is most effective in helping people recover from alcoholism. You could collect data on how many patients who visited a cognitive-behavioral therapist went into recovery, how many who visited a Gestalt therapist went into recovery, etc.
Conducting an ANOVA will take the mean (the average number of patients who go into recovery) for each type of therapy and compare them to find out which type of therapy leads to the highest average number of patients who recover from alcoholism.
A paired t-test, also common in the social sciences, is used to compare different sets of data from the same group.
The results section for the essay "Note-taking Methods and Classroom Performance" uses a paired t-test (go to Blackboard > readings > Example Results/Findings Sections > Results section from undergraduate essay on "Note-taking Methods and Classroom Performance").
This type of test is used in "before and after" experiments: you gather data from participants before having them do something, have them do the thing, then gather data again afterward to see if the thing had an effect.
For example, if you want to find out whether a type of medication can help reduce patient anxiety prior to surgery, you could survey the participants regarding their level of anxiety using a 5-point scale and find out that the mean anxiety level is a 4.
Then you give the participants a type of medication and survey them again. Now the mean anxiety level is a 2.
A paired t-test will let you know if that change in numbers means something.
In other words, it will tell you if the change is statistically significant.
Statistical significance is indicated by a p-value. If a p-value is less than .05 (P > .05), it is statistically significant.
In the case of the patient surgery anxiety study, a p-value of .03 (p = .03), that means something.
If the p-value was .16, the difference in mean anxiety levels before and after administering the medication is probably just due to random chance. It is not statistically significant.
Researchers like to find statistical significance, but it's not the end of the world if they don't. If you find that a certain type of medication doesn't reduce pre-surgery anxiety, publishing the results of your research study will let other researchers know not to try the same thing and to look for other ways to reduce pre-surgery anxiety.
Analyzing Qualitative Data


What themes or patterns you look for will depend on your research topic or research question.
For the example above, the researcher's research question might have been, "What attitudes and opinions do sophomore university students have toward living alone?"
If your research question were "What attitudes do children in families in which at least one parent is an alcoholic have toward family therapy?," you might code for themes like negative feelings, positive feelings, relationship with father, relationship with mother, relationship with siblings, relationship with therapist, attitudes toward therapy, and so on.
The sample findings section from the essay "Women's Experiences after Leaving a Shelter" coded for isolation, value of social support, abandonment, etc. and the sample findings section from the essay "Investigation of Self-Discovery in Abuse Survivors" coded for sense of self, sense of self in relation to others, achievement, etc.
Analyzing Quantitative Data: What Goes into Your Research Paper?
The results sections for quantitative studies tend to be short and simple.
First and foremost, you want to present your results and do so objectively.
That means you don't try to explain what they mean: you just show people the numbers and let them make up their own minds about them.
To do that, you first need to explain what statistical analysis you used.
Second, you'll want to mention any important results, like any trends, differences, similarities, or correlations that you found.
If you think it would be helpful for you and/or your readers, you can use visuals to present your results, such as graphs or charts.
Analyzing Qualitative Data: What Goes into Your Research Paper?
Your findings section should describe the data analysis process.
Your description of the data analysis process should explain how you coded your data: specifically, you should describe the themes or patterns you found.
Use should also use quotes from participants. This allows your readers to understand your participants' stories and points of view, not just yours as the researcher.
Share This Article