This post has not been vetted or endorsed by BuzzFeed's editorial staff. BuzzFeed Community is a place where anyone can create a post or quiz. Try making your own!

1. Since 1980, the percentage people of color has more than tripled in Fairfax, VA.

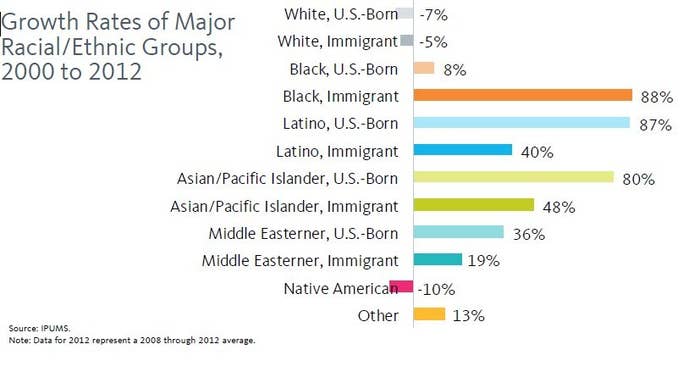
2. Communities of color and immigrant populations are leading the county’s growth. Nearly 1 in 3 residents of Fairfax are immigrants.
3. Child poverty rates are 4 times higher among residents of color.

4. The region has seen a sharp rise in income inequality since 1979.

5. Residents of color in Fairfax are paid $9-16/hour less than their White counterparts.

6. Racial gaps in income cost the county $26B in 2012.

For more information on Fairfax or to see equity profiles for other metropolitan areas, check out the National Equity Atlas.
Share This Article