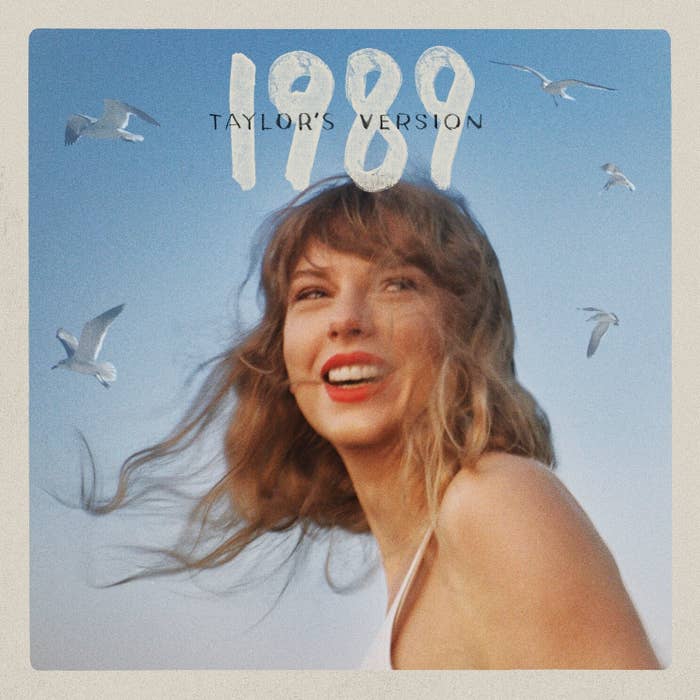
Hi, I'm Andrew, a senior data analyst for BuzzFeed and a Swiftie! As each Taylor’s Version is released, (now updated for 1989), I thought it would be fun to investigate: which Taylor's Versions sound the closest and the most different to their first versions?*
Where does the data come from?
The Spotify API holds descriptive audio characteristics* for songs. I gathered this data for every Taylor's Version and its first version on the deluxe editions: 20 songs from Fearless (I'm considering "If This Was A Movie" to be a Fearless song), 20 from Red, 16 from Speak Now, and 16 from 1989.
The variables I chose are:
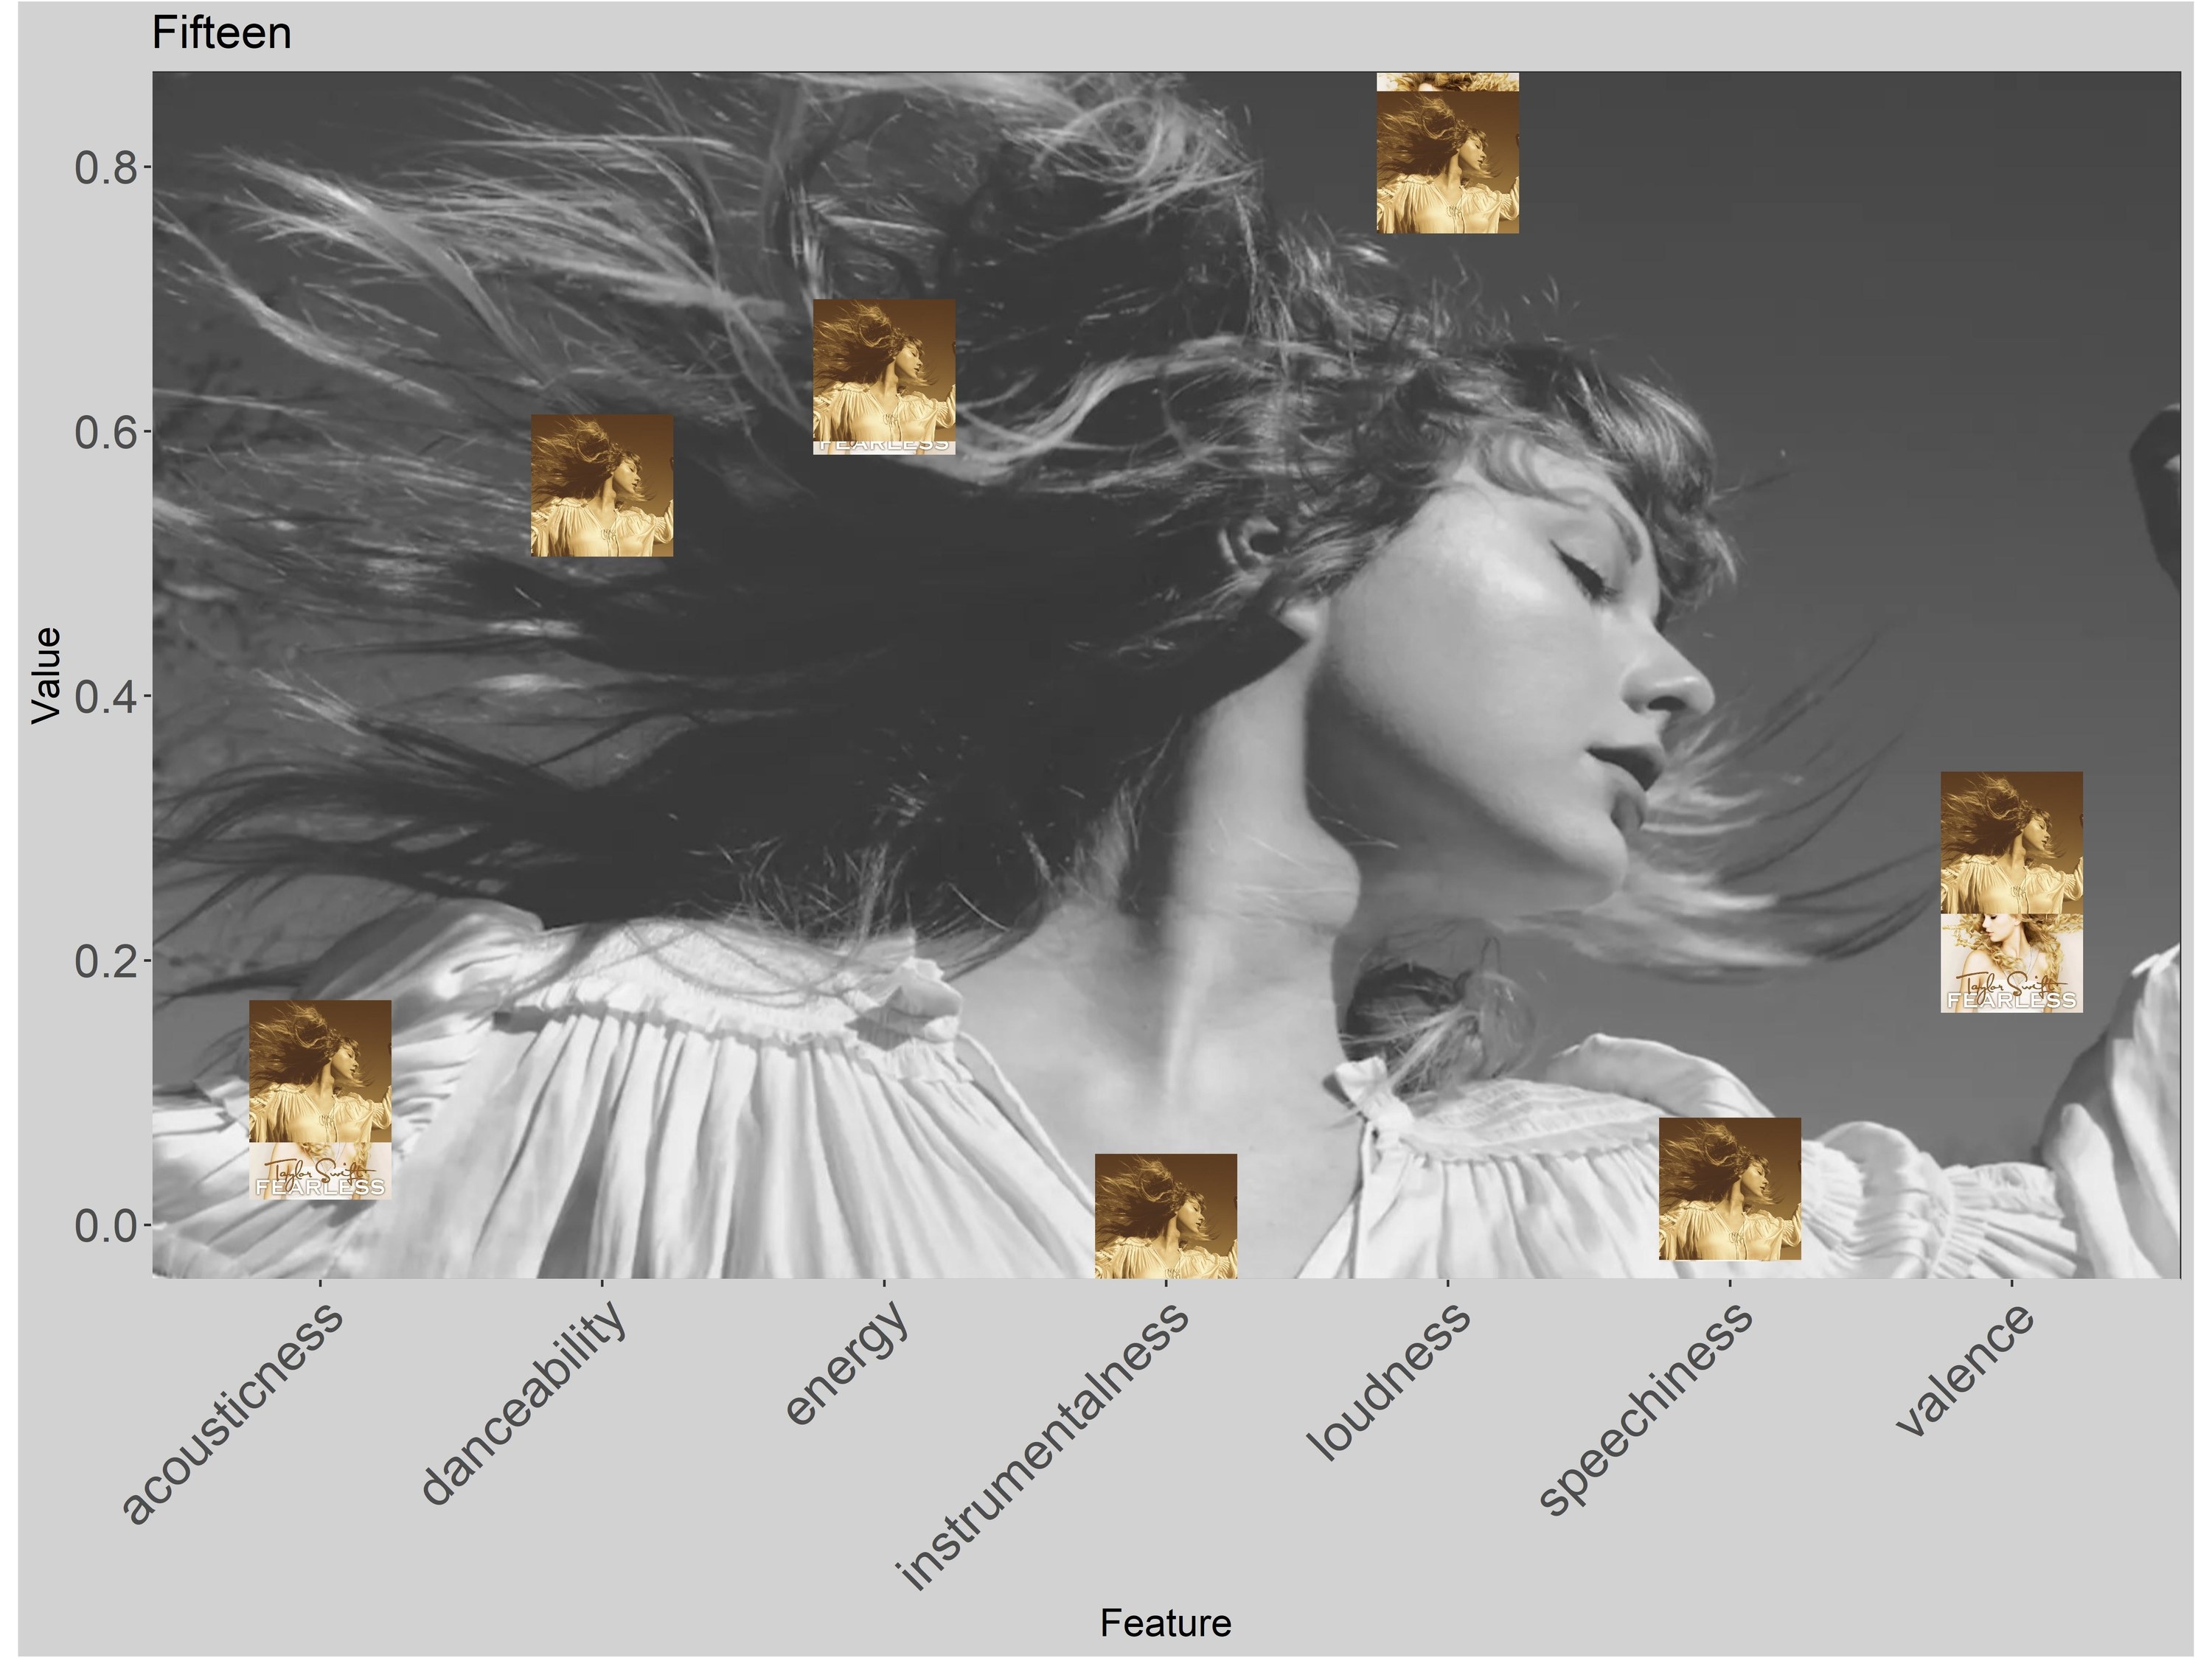
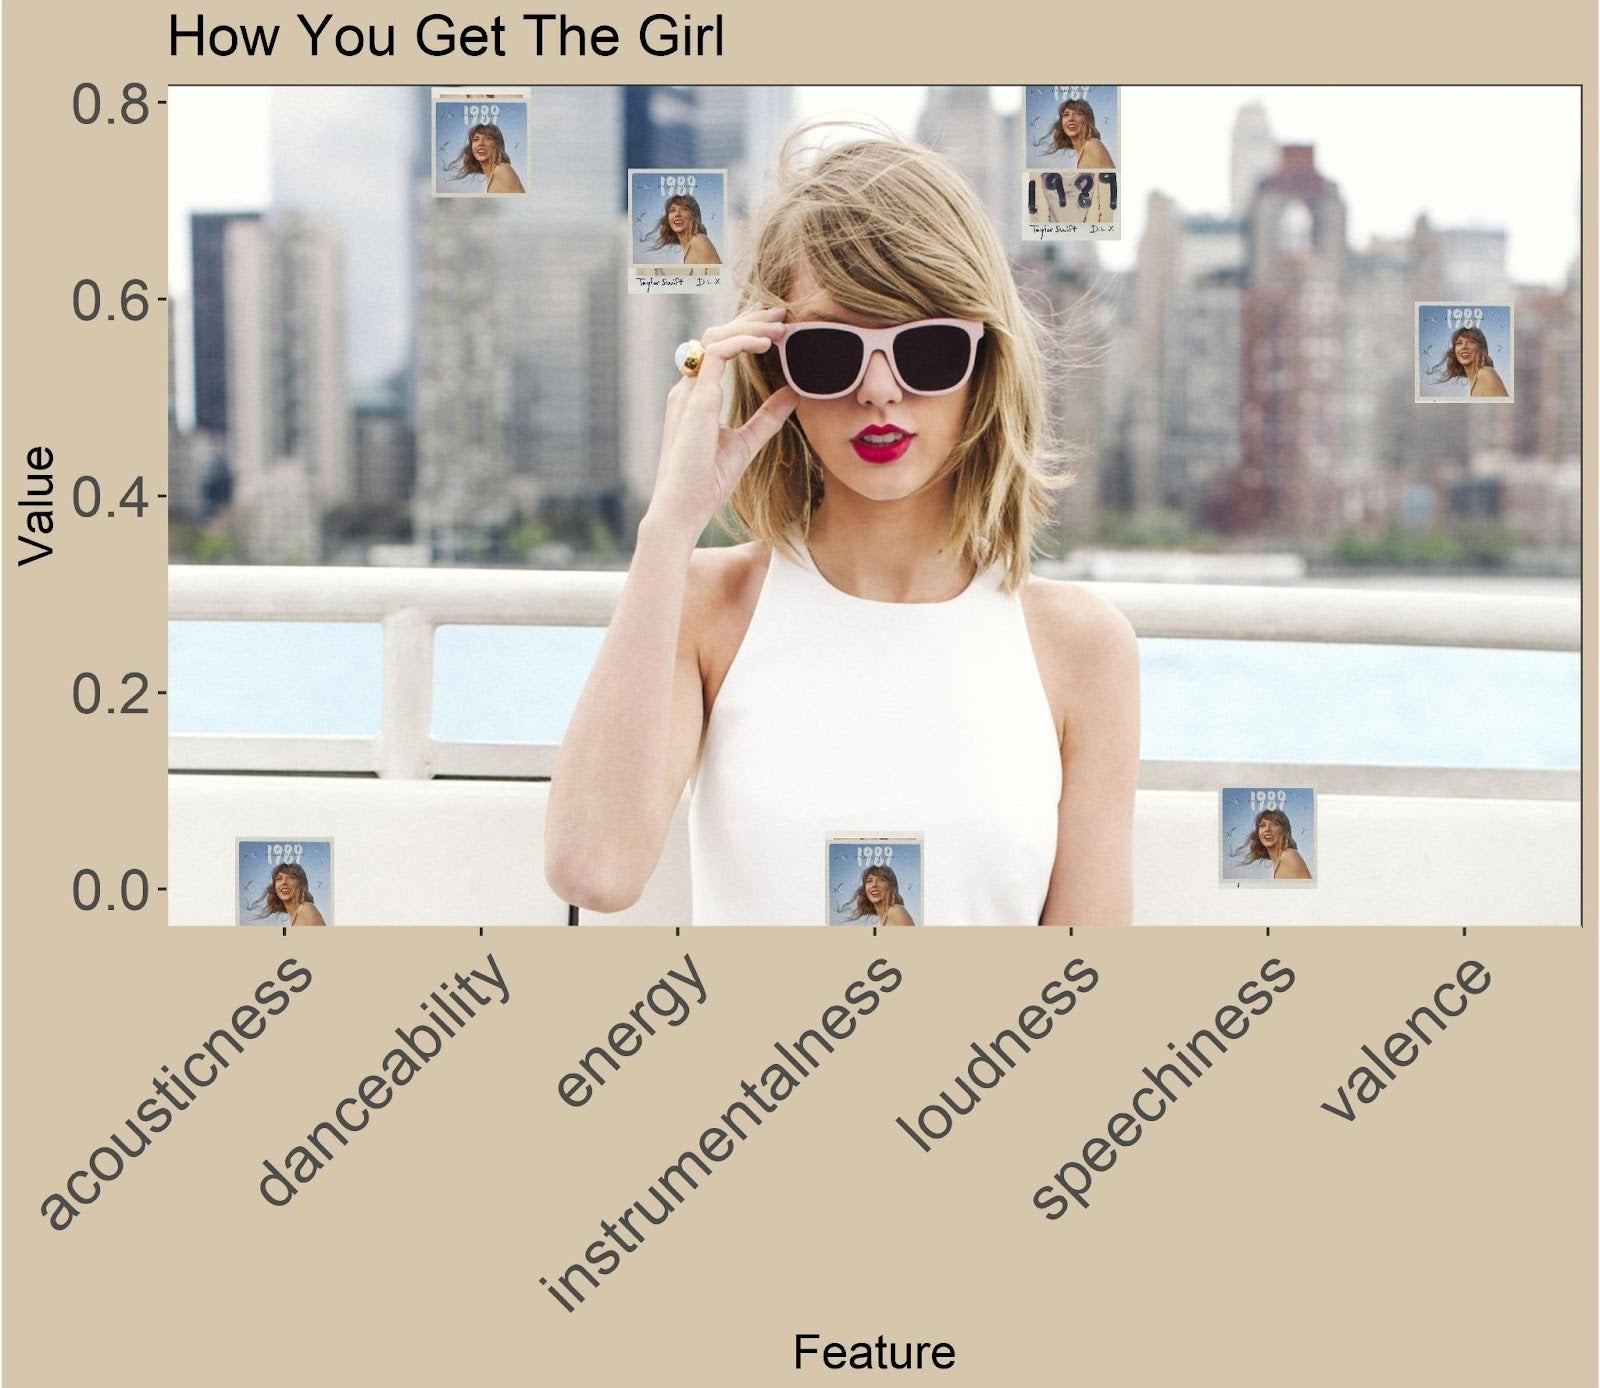
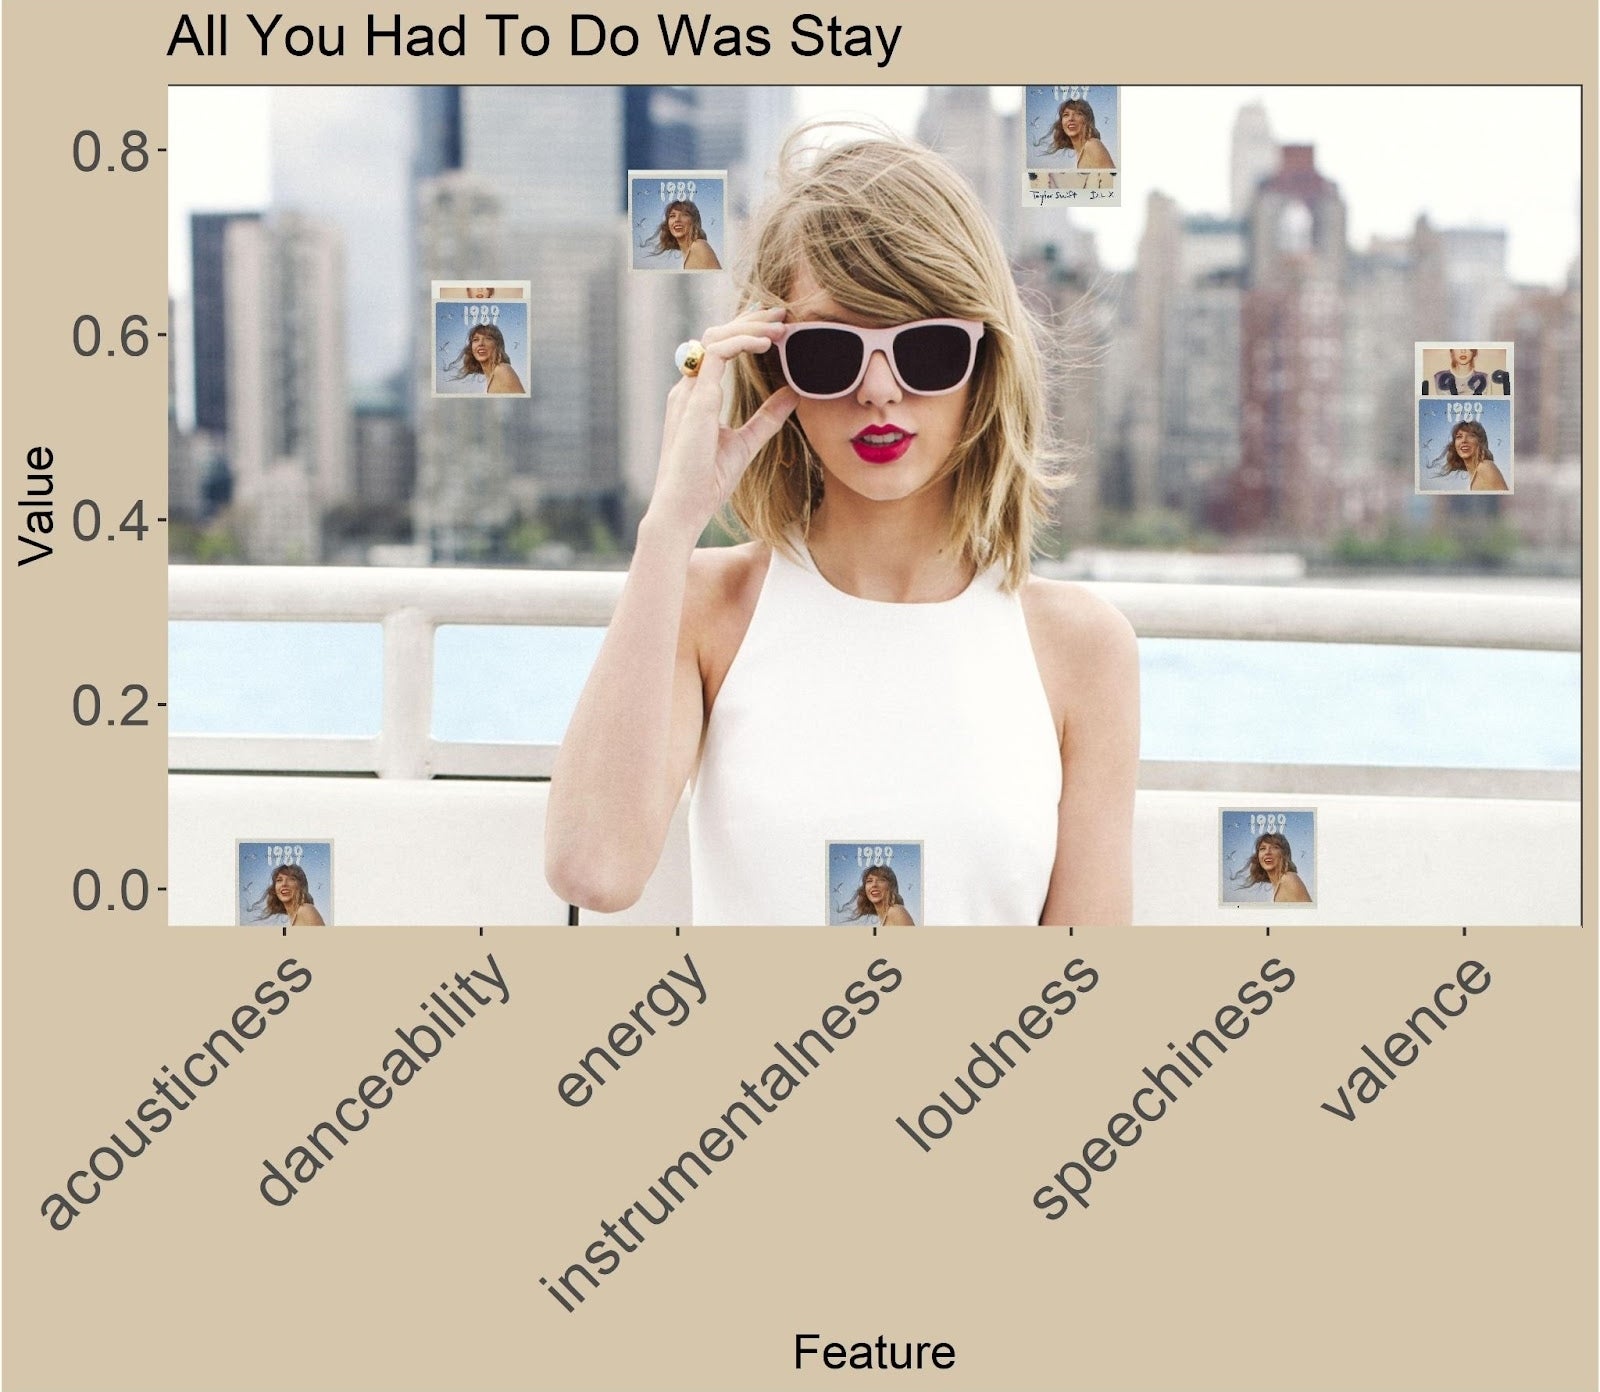
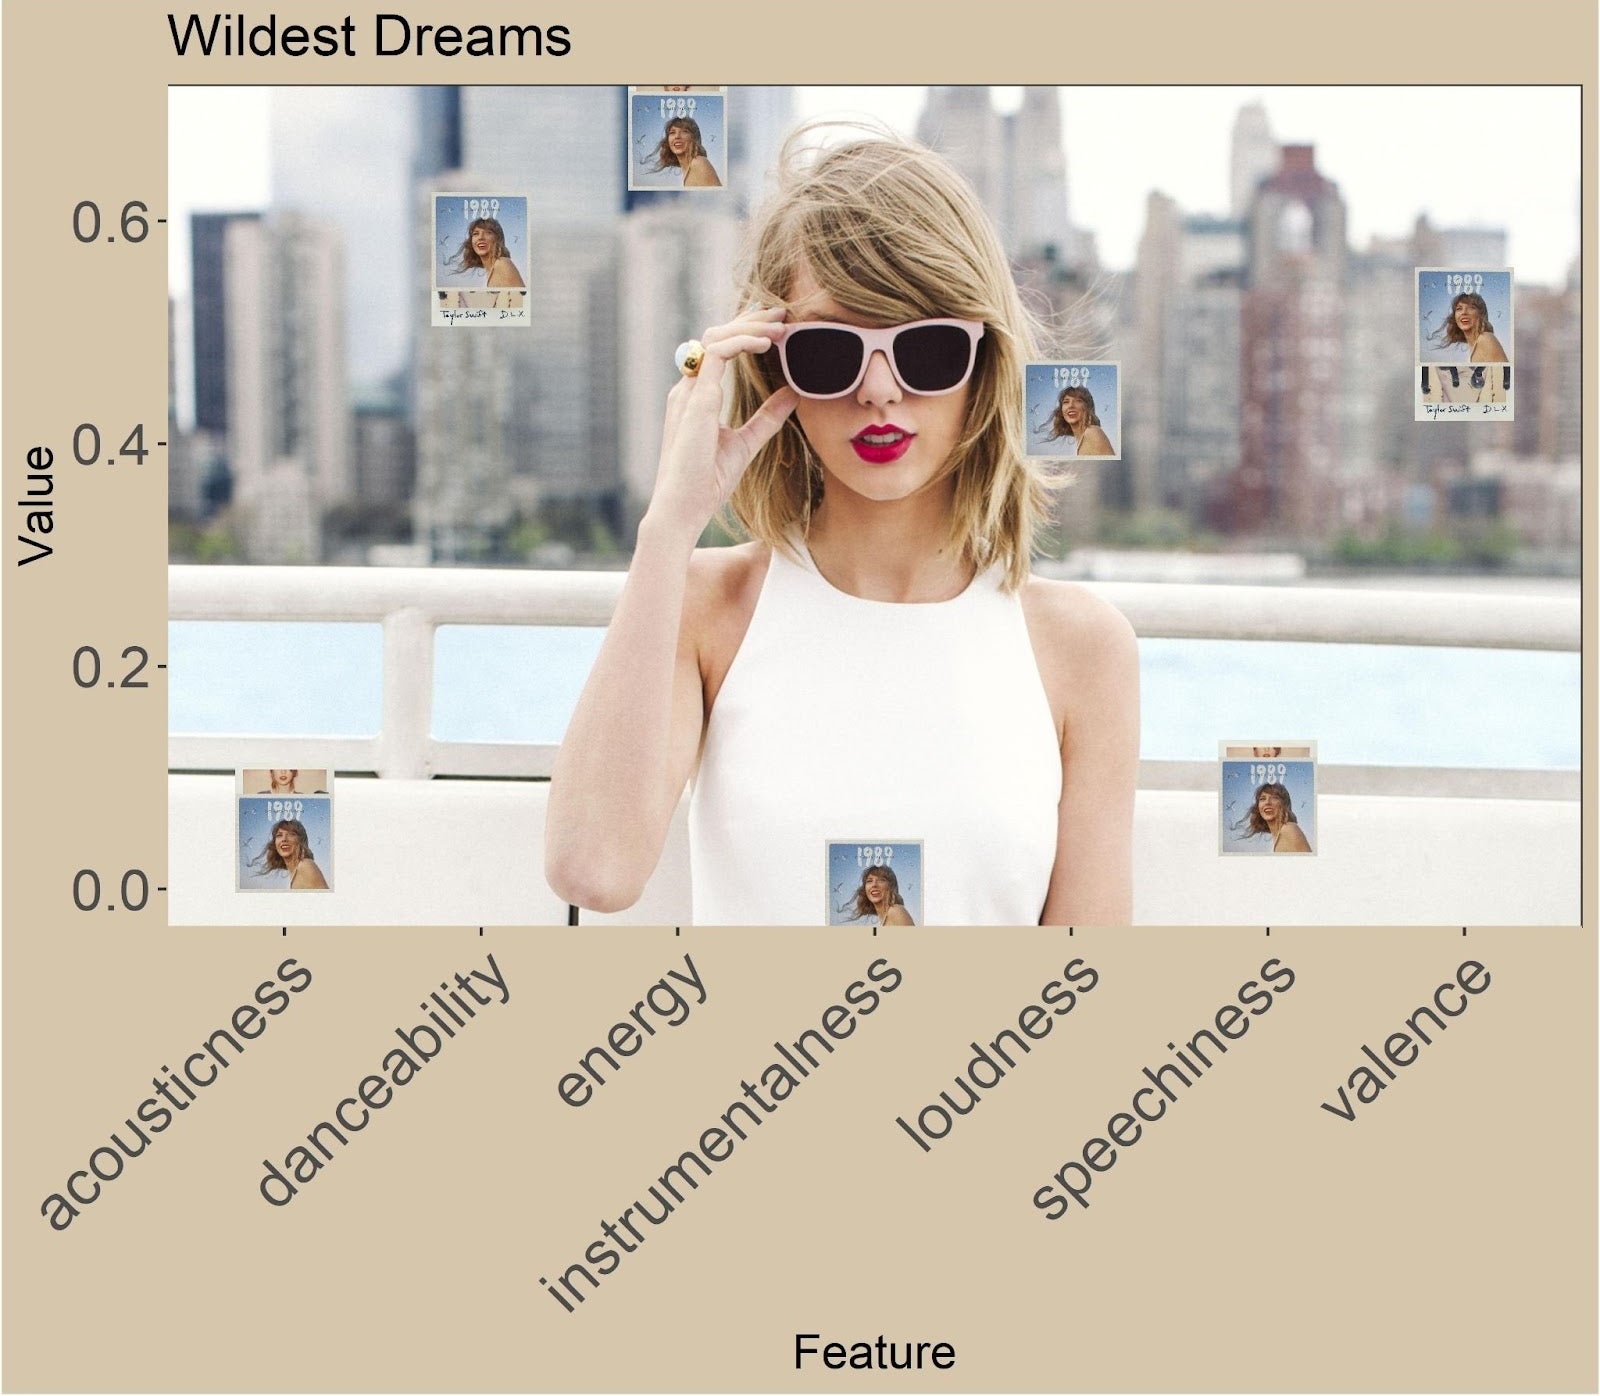
1) Acousticness: a measure between 0 and 1 of how "acoustic" a track is. The closer to 1, the more acoustic.
2) Danceability: a measure between 0 and 1 of how well the track can be used for dancing (closer to 1 means more danceable). It takes into account metrics like tempo and rhythm.
3) Energy: a measure between 0 and 1 of intensity within a track ("energetic tracks feel fast, loud, and noisy"). A higher score means a higher energy.
4) Instrumentalness: a measure between 0 and 1 of whether a track is instrumental. A measure closer to 1 is a higher likelihood of no vocals.
5) Speechness: a measure between 0 and 1 detecting spoken word within a track. The higher the measure, the higher the probability that the track is spoken word.
6) Valence: a measure between 0 and 1 describing the "musical positiveness" of a track (0: most sad vs. 1: most happy-sounding).
7) Loudness: The overall loudness of a track, in decibels.
Every variable in the data set ranges between 0 and 1, except for loudness. To make sure every variable was on the same scale, I normalized the loudness over each pair of albums to range between 0 and 1.
I chose to exclude metrics like liveness, which detects the presence of an audience within a track (none of the songs were recorded live), and things like tempo, key, and time signature which remain consistent between both versions.
(See link above for the full definitions of the variables).
The methodology:
Here's the 20 pairs (Taylor's Version vs. first version) that are the most different from each other:
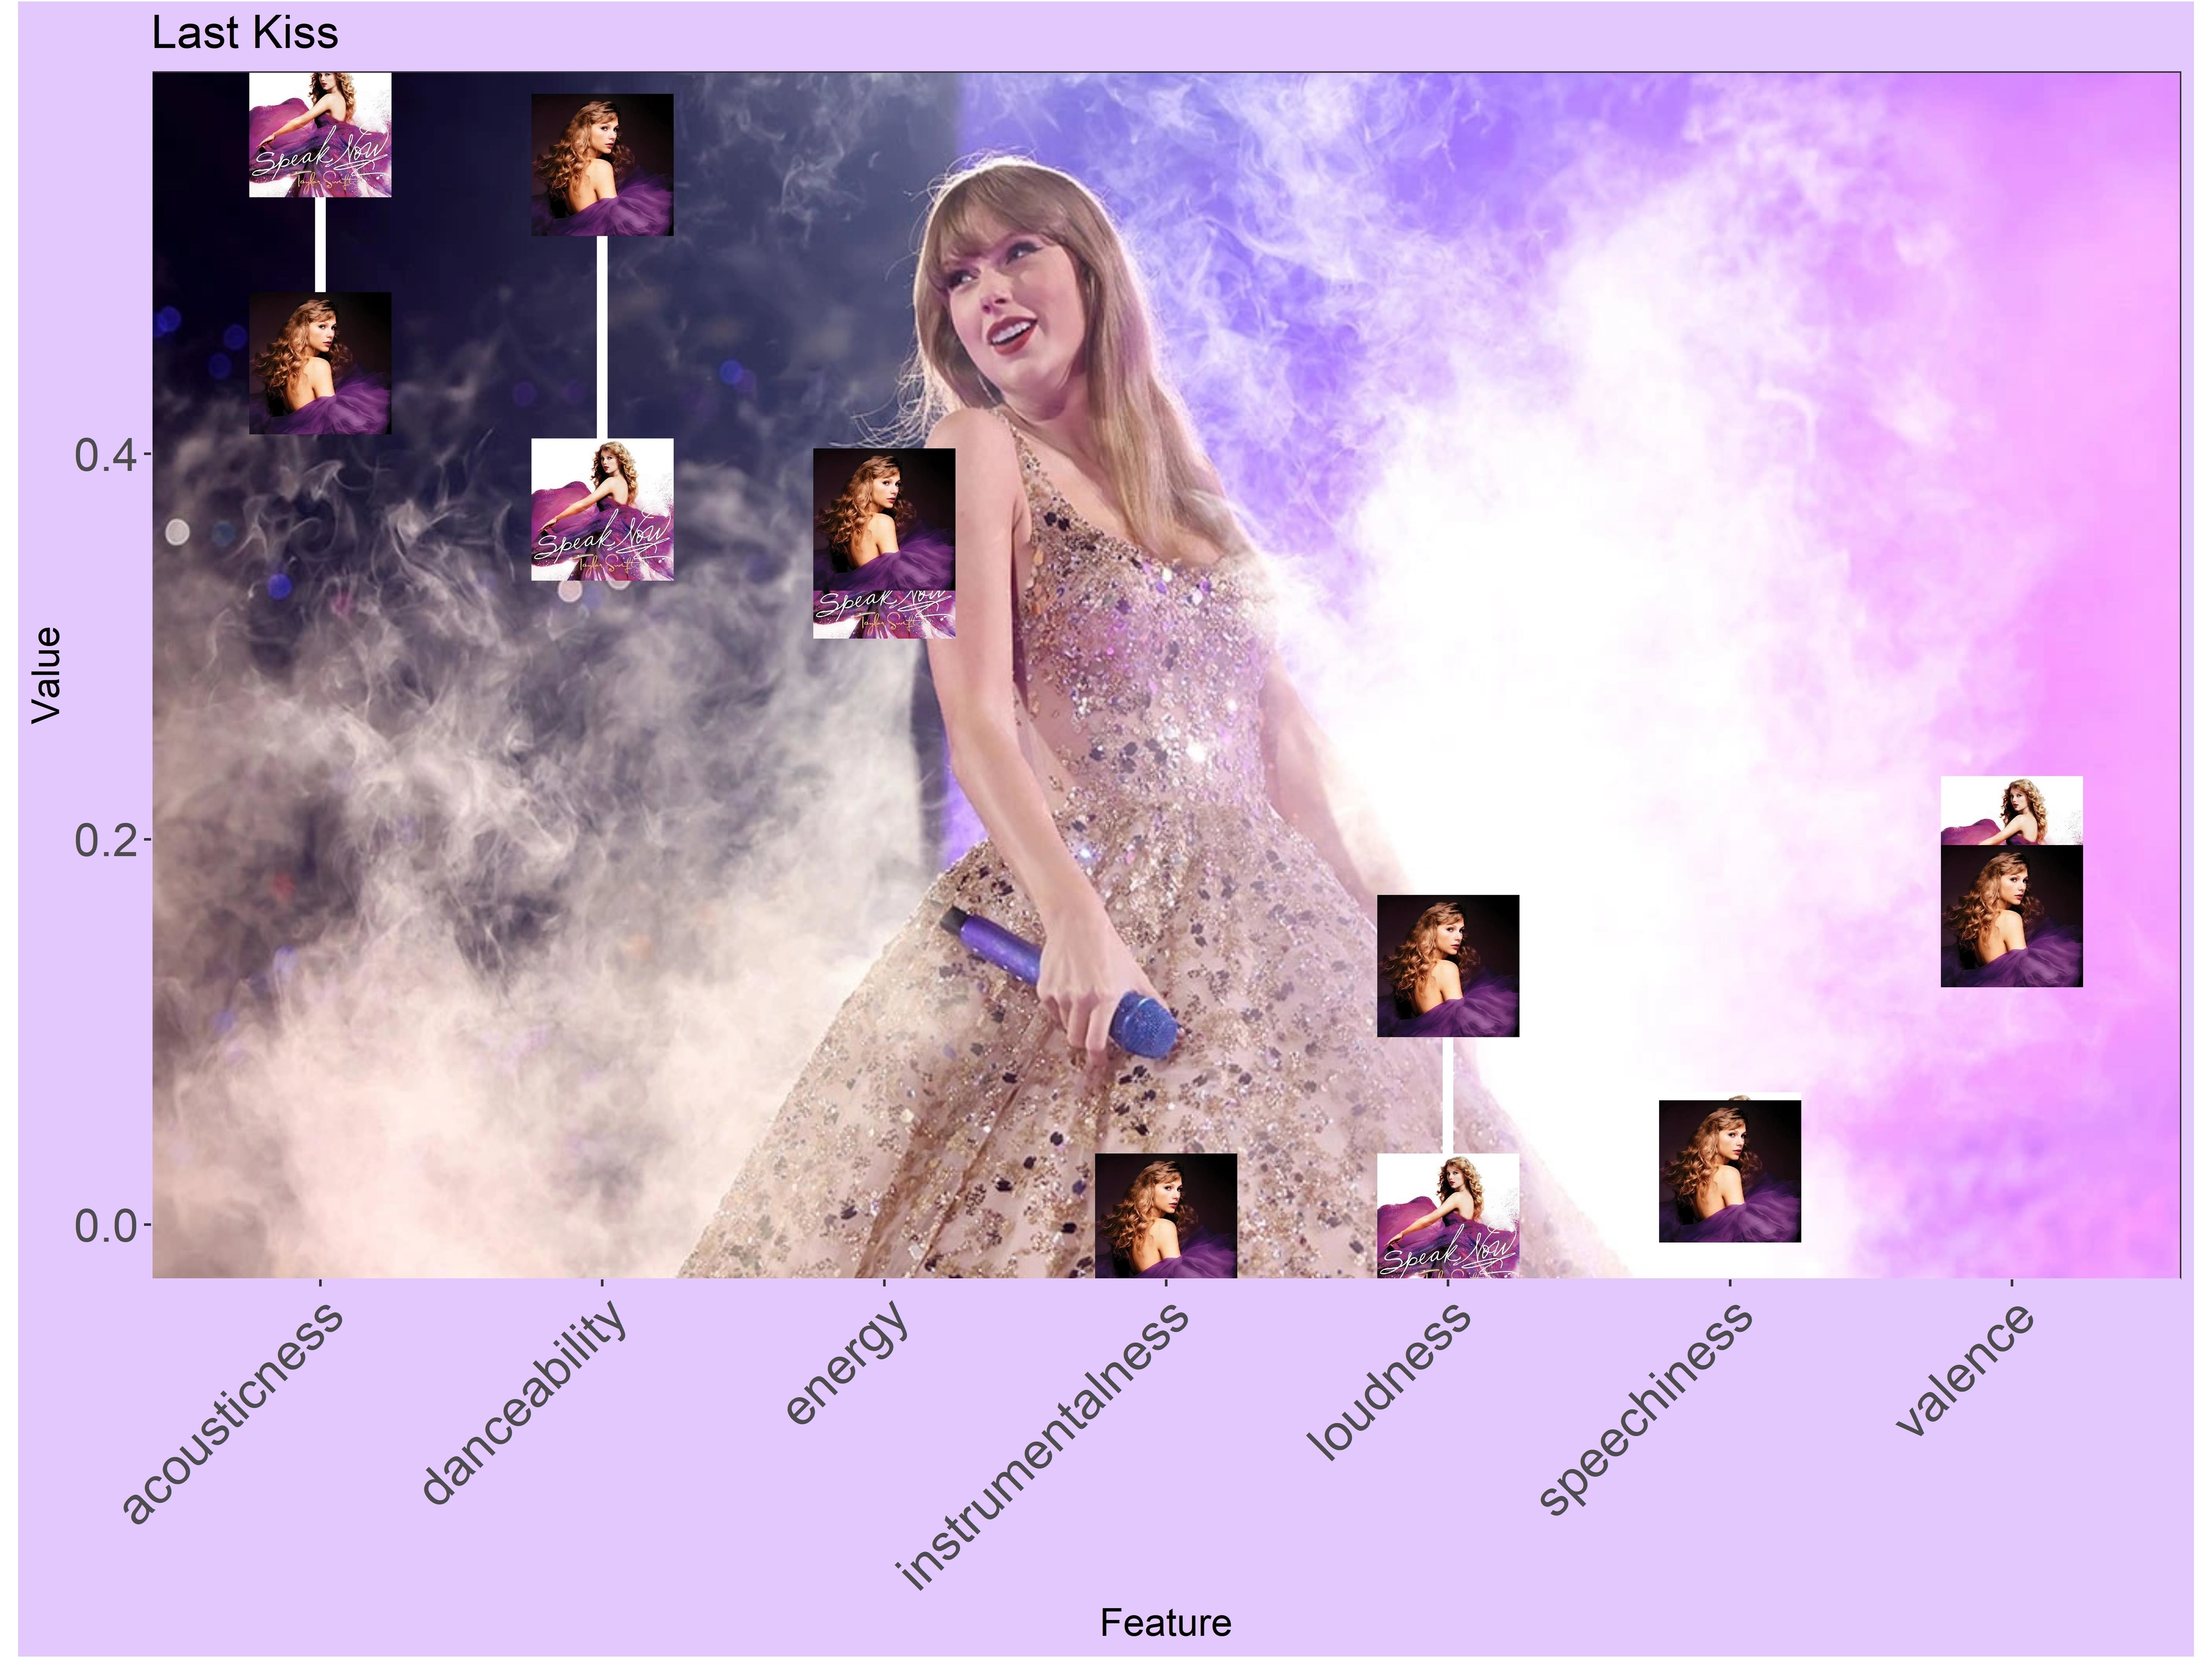
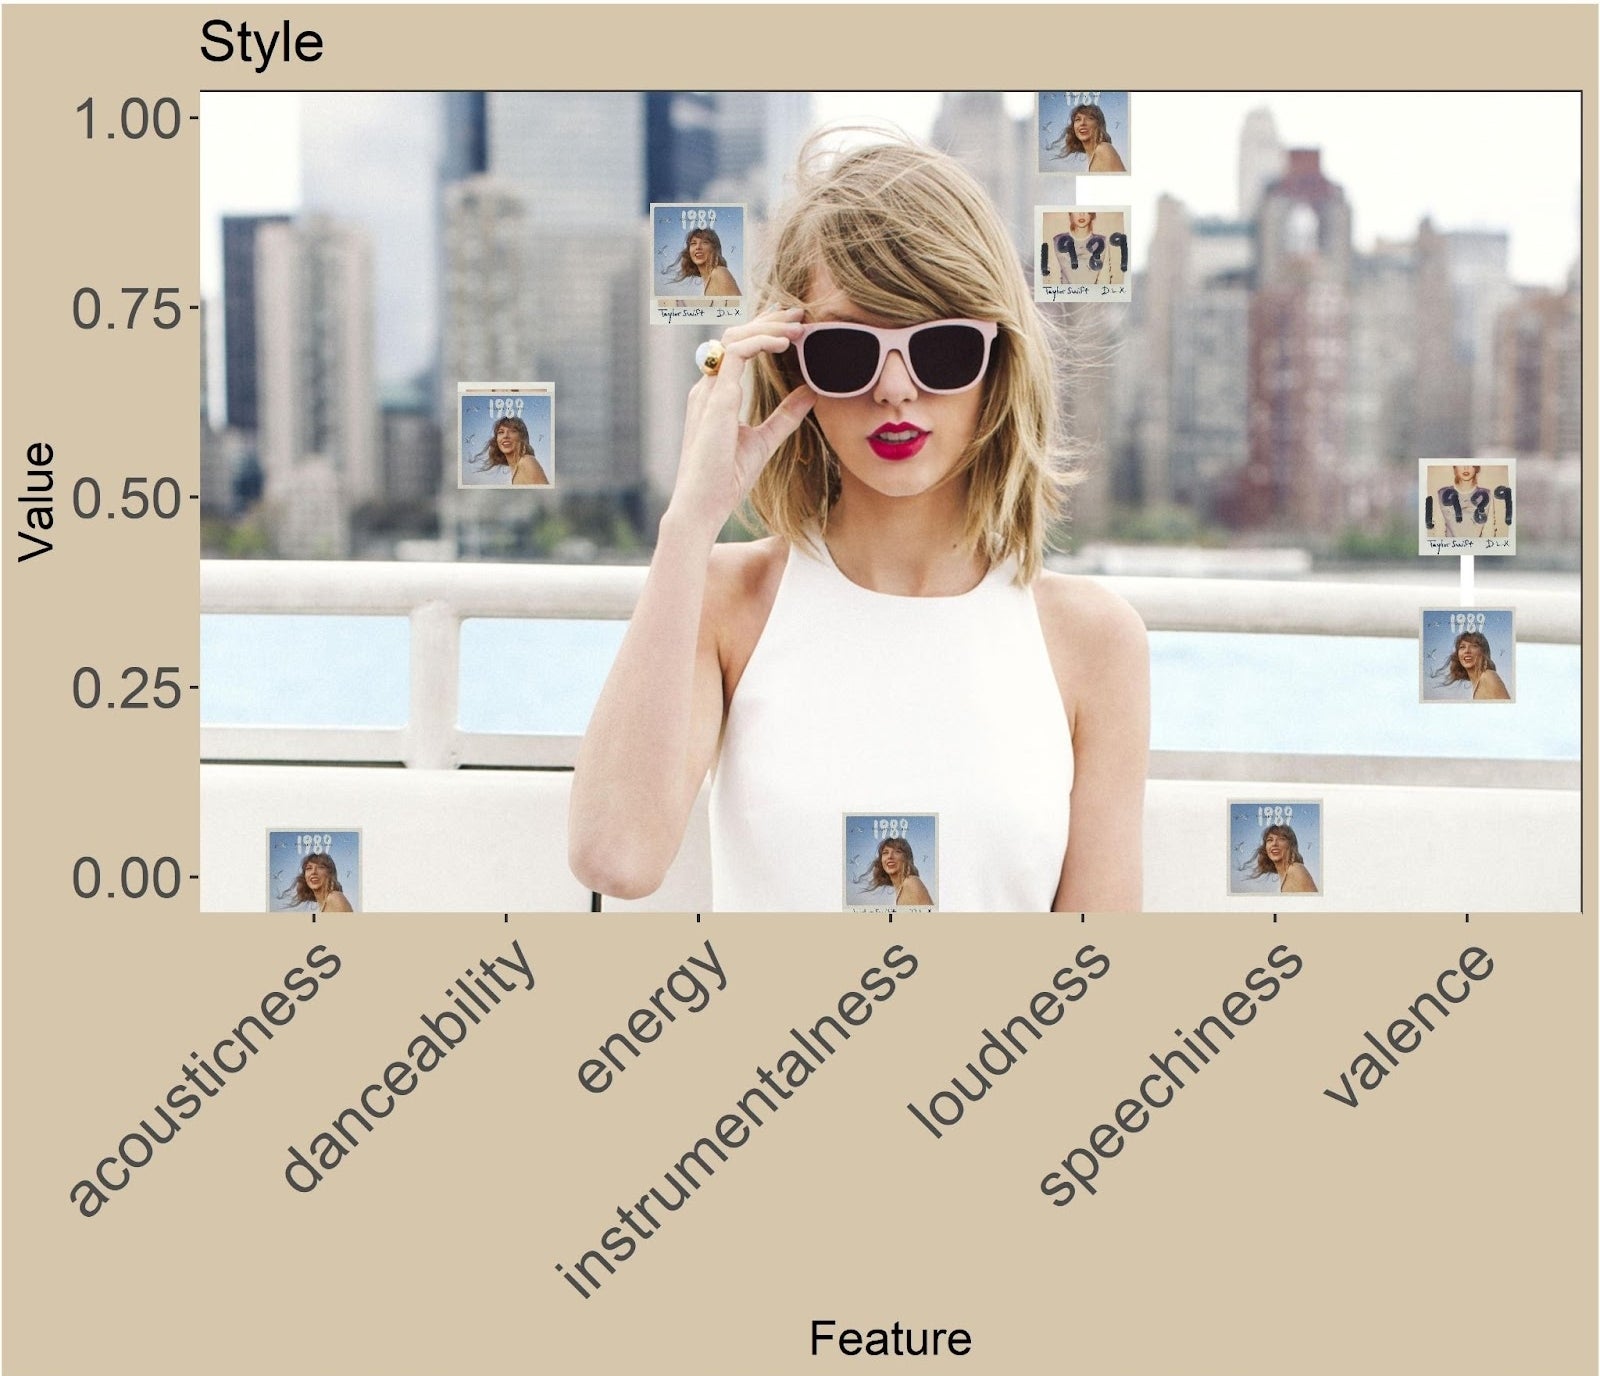
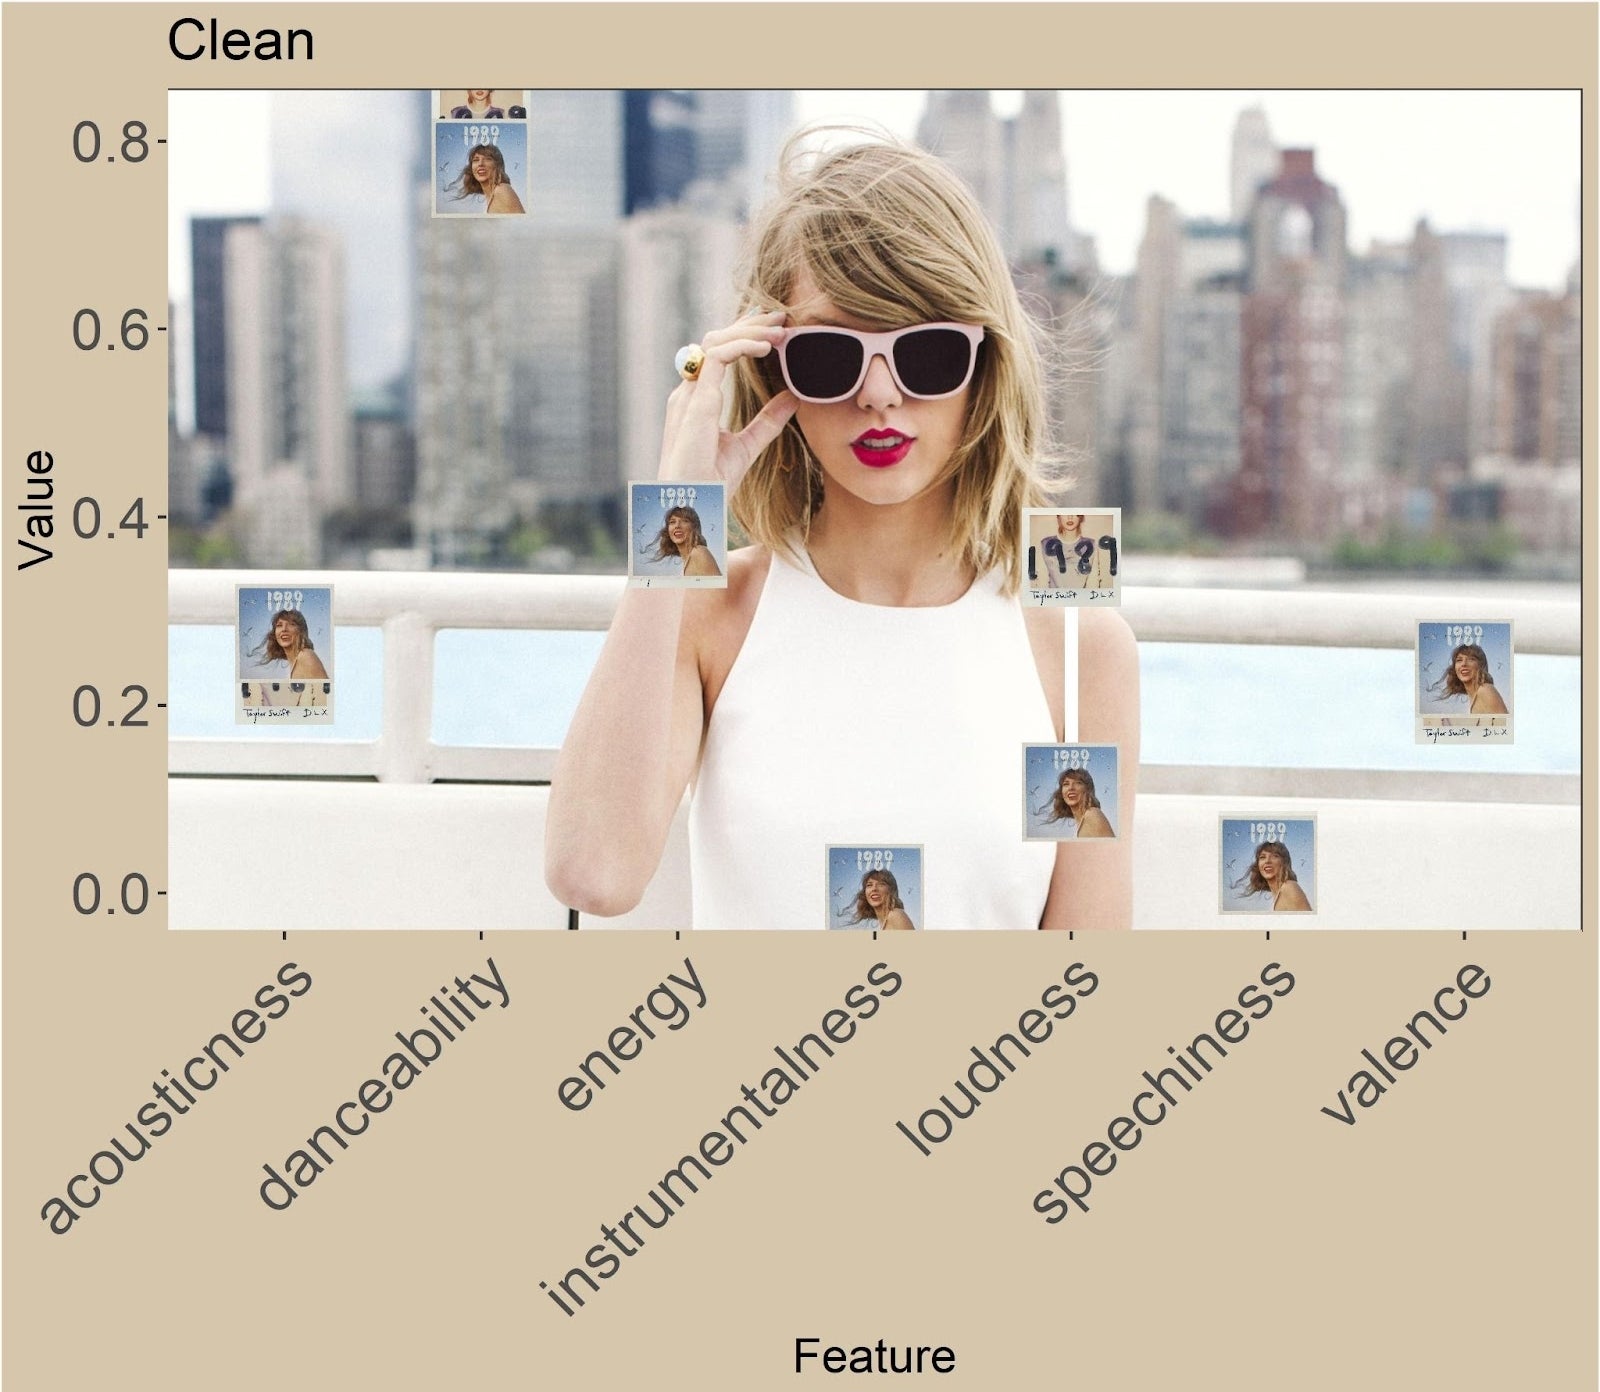
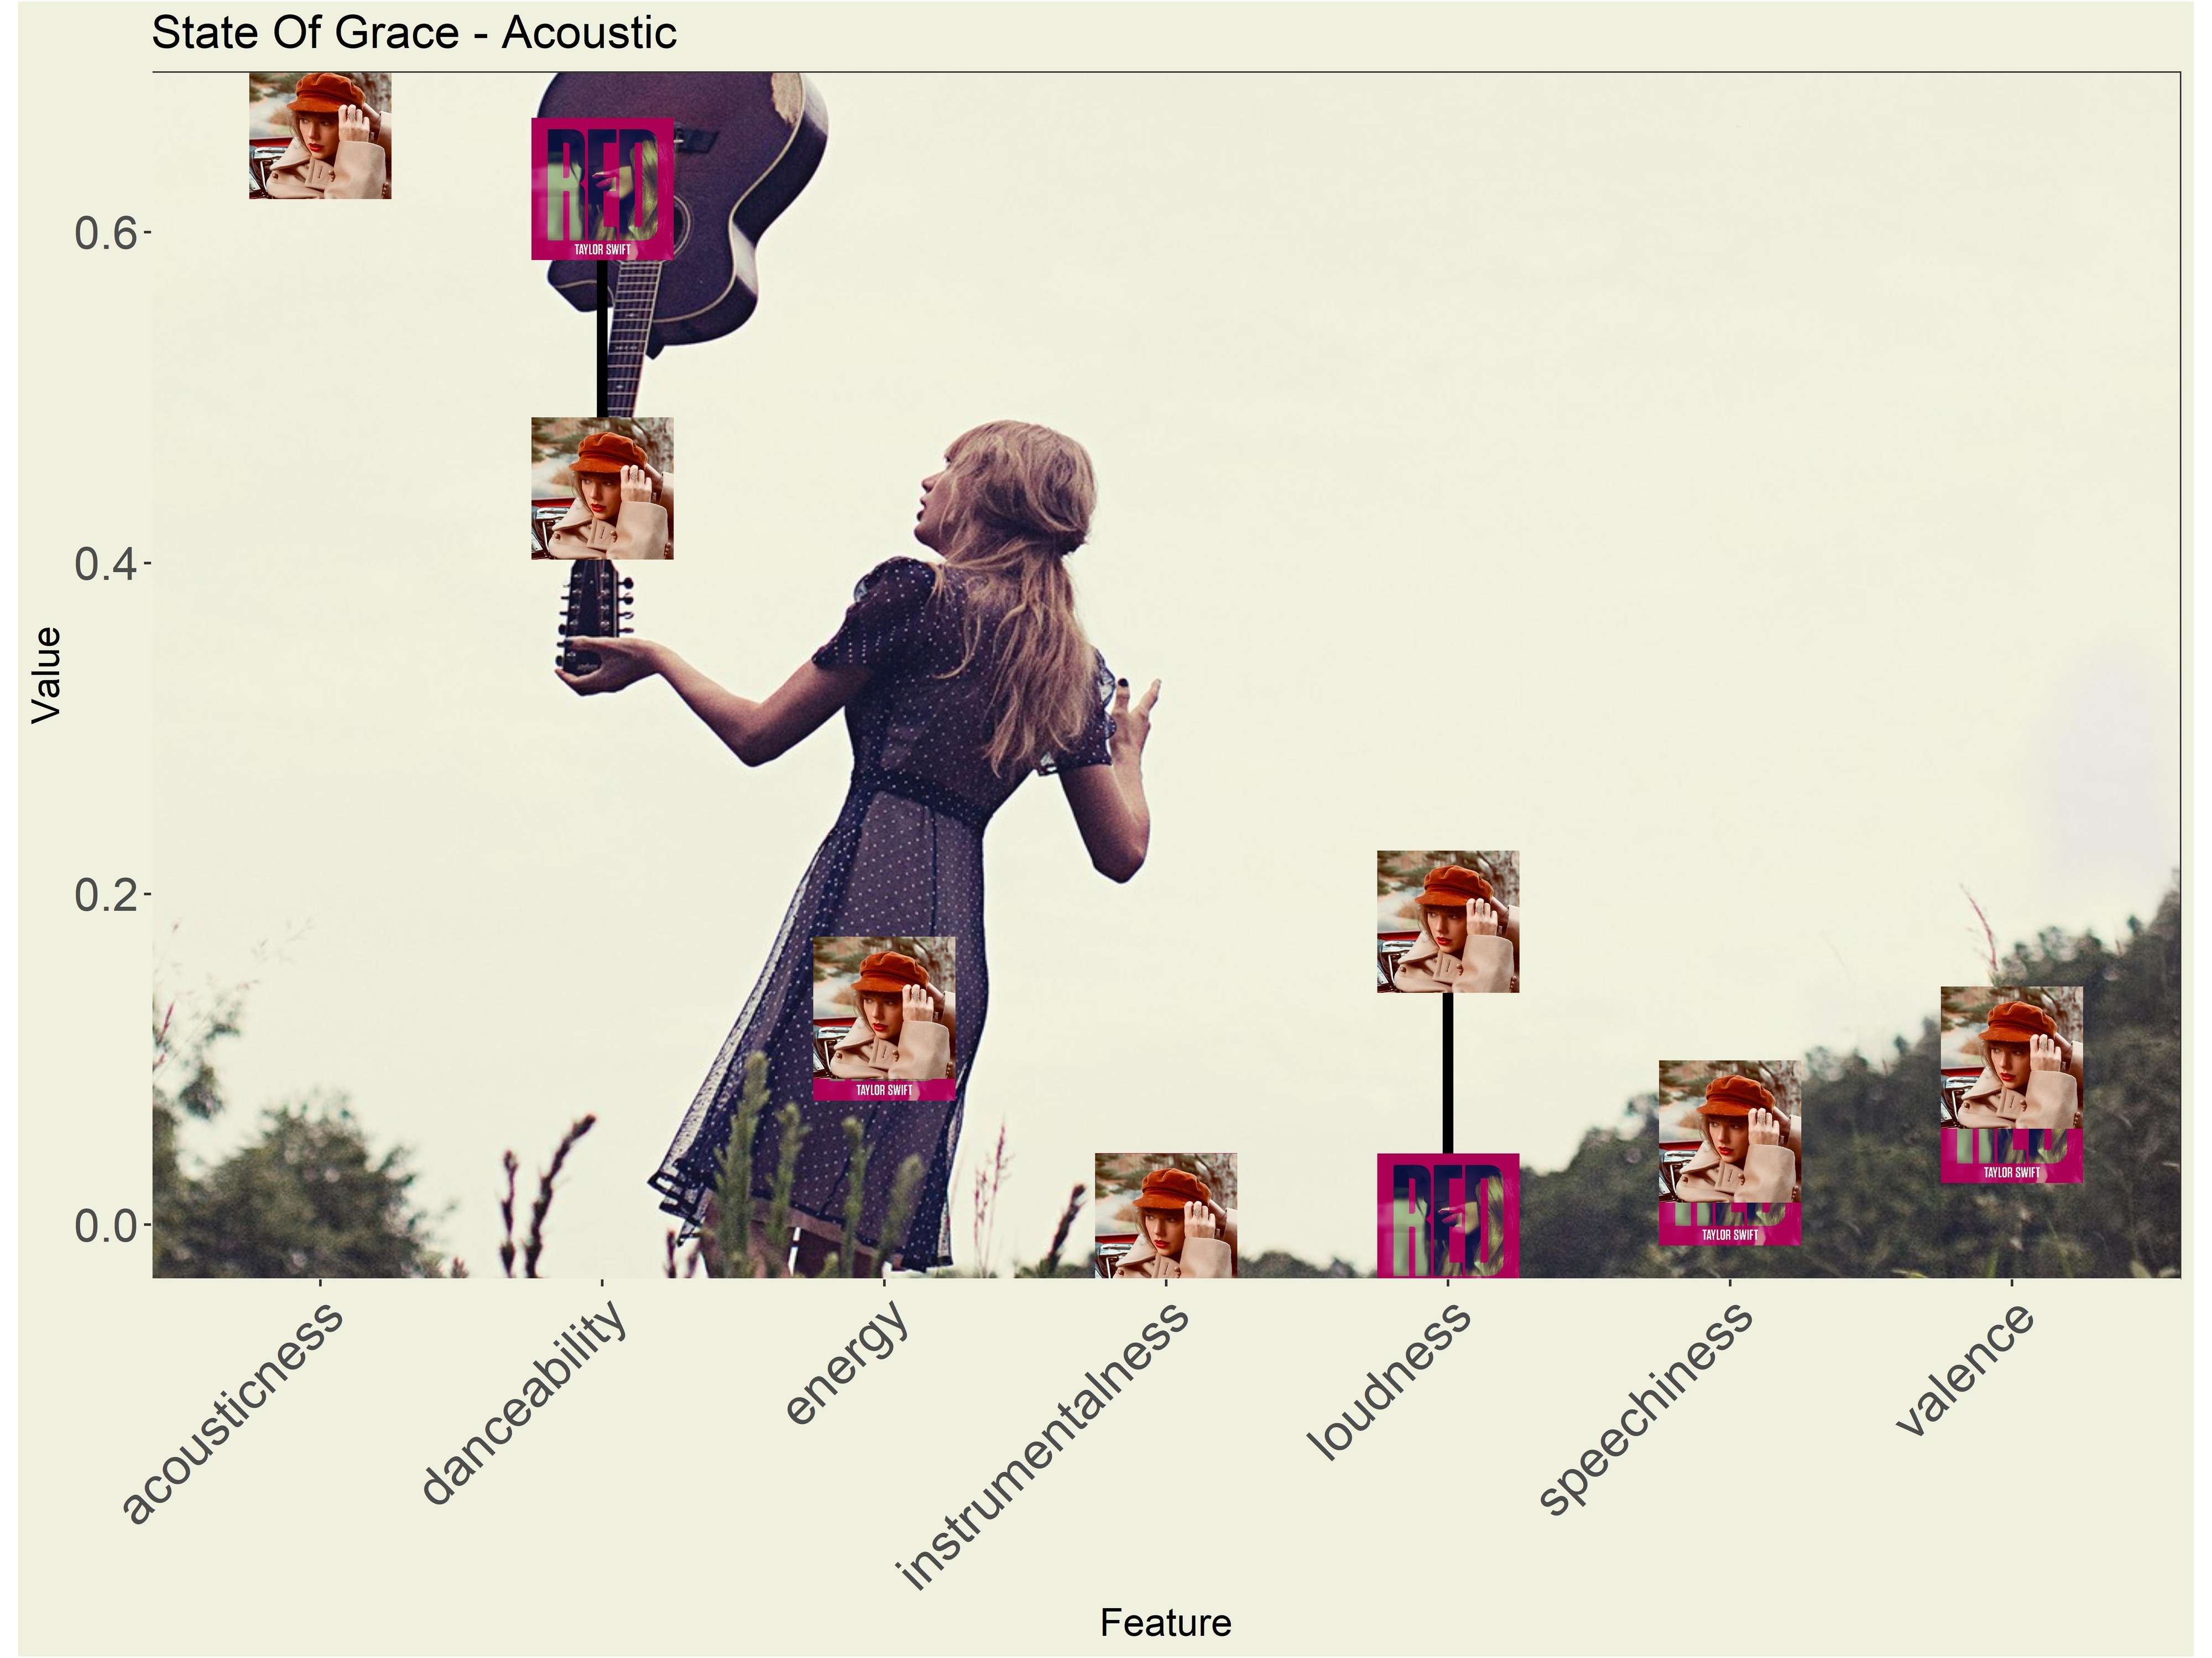
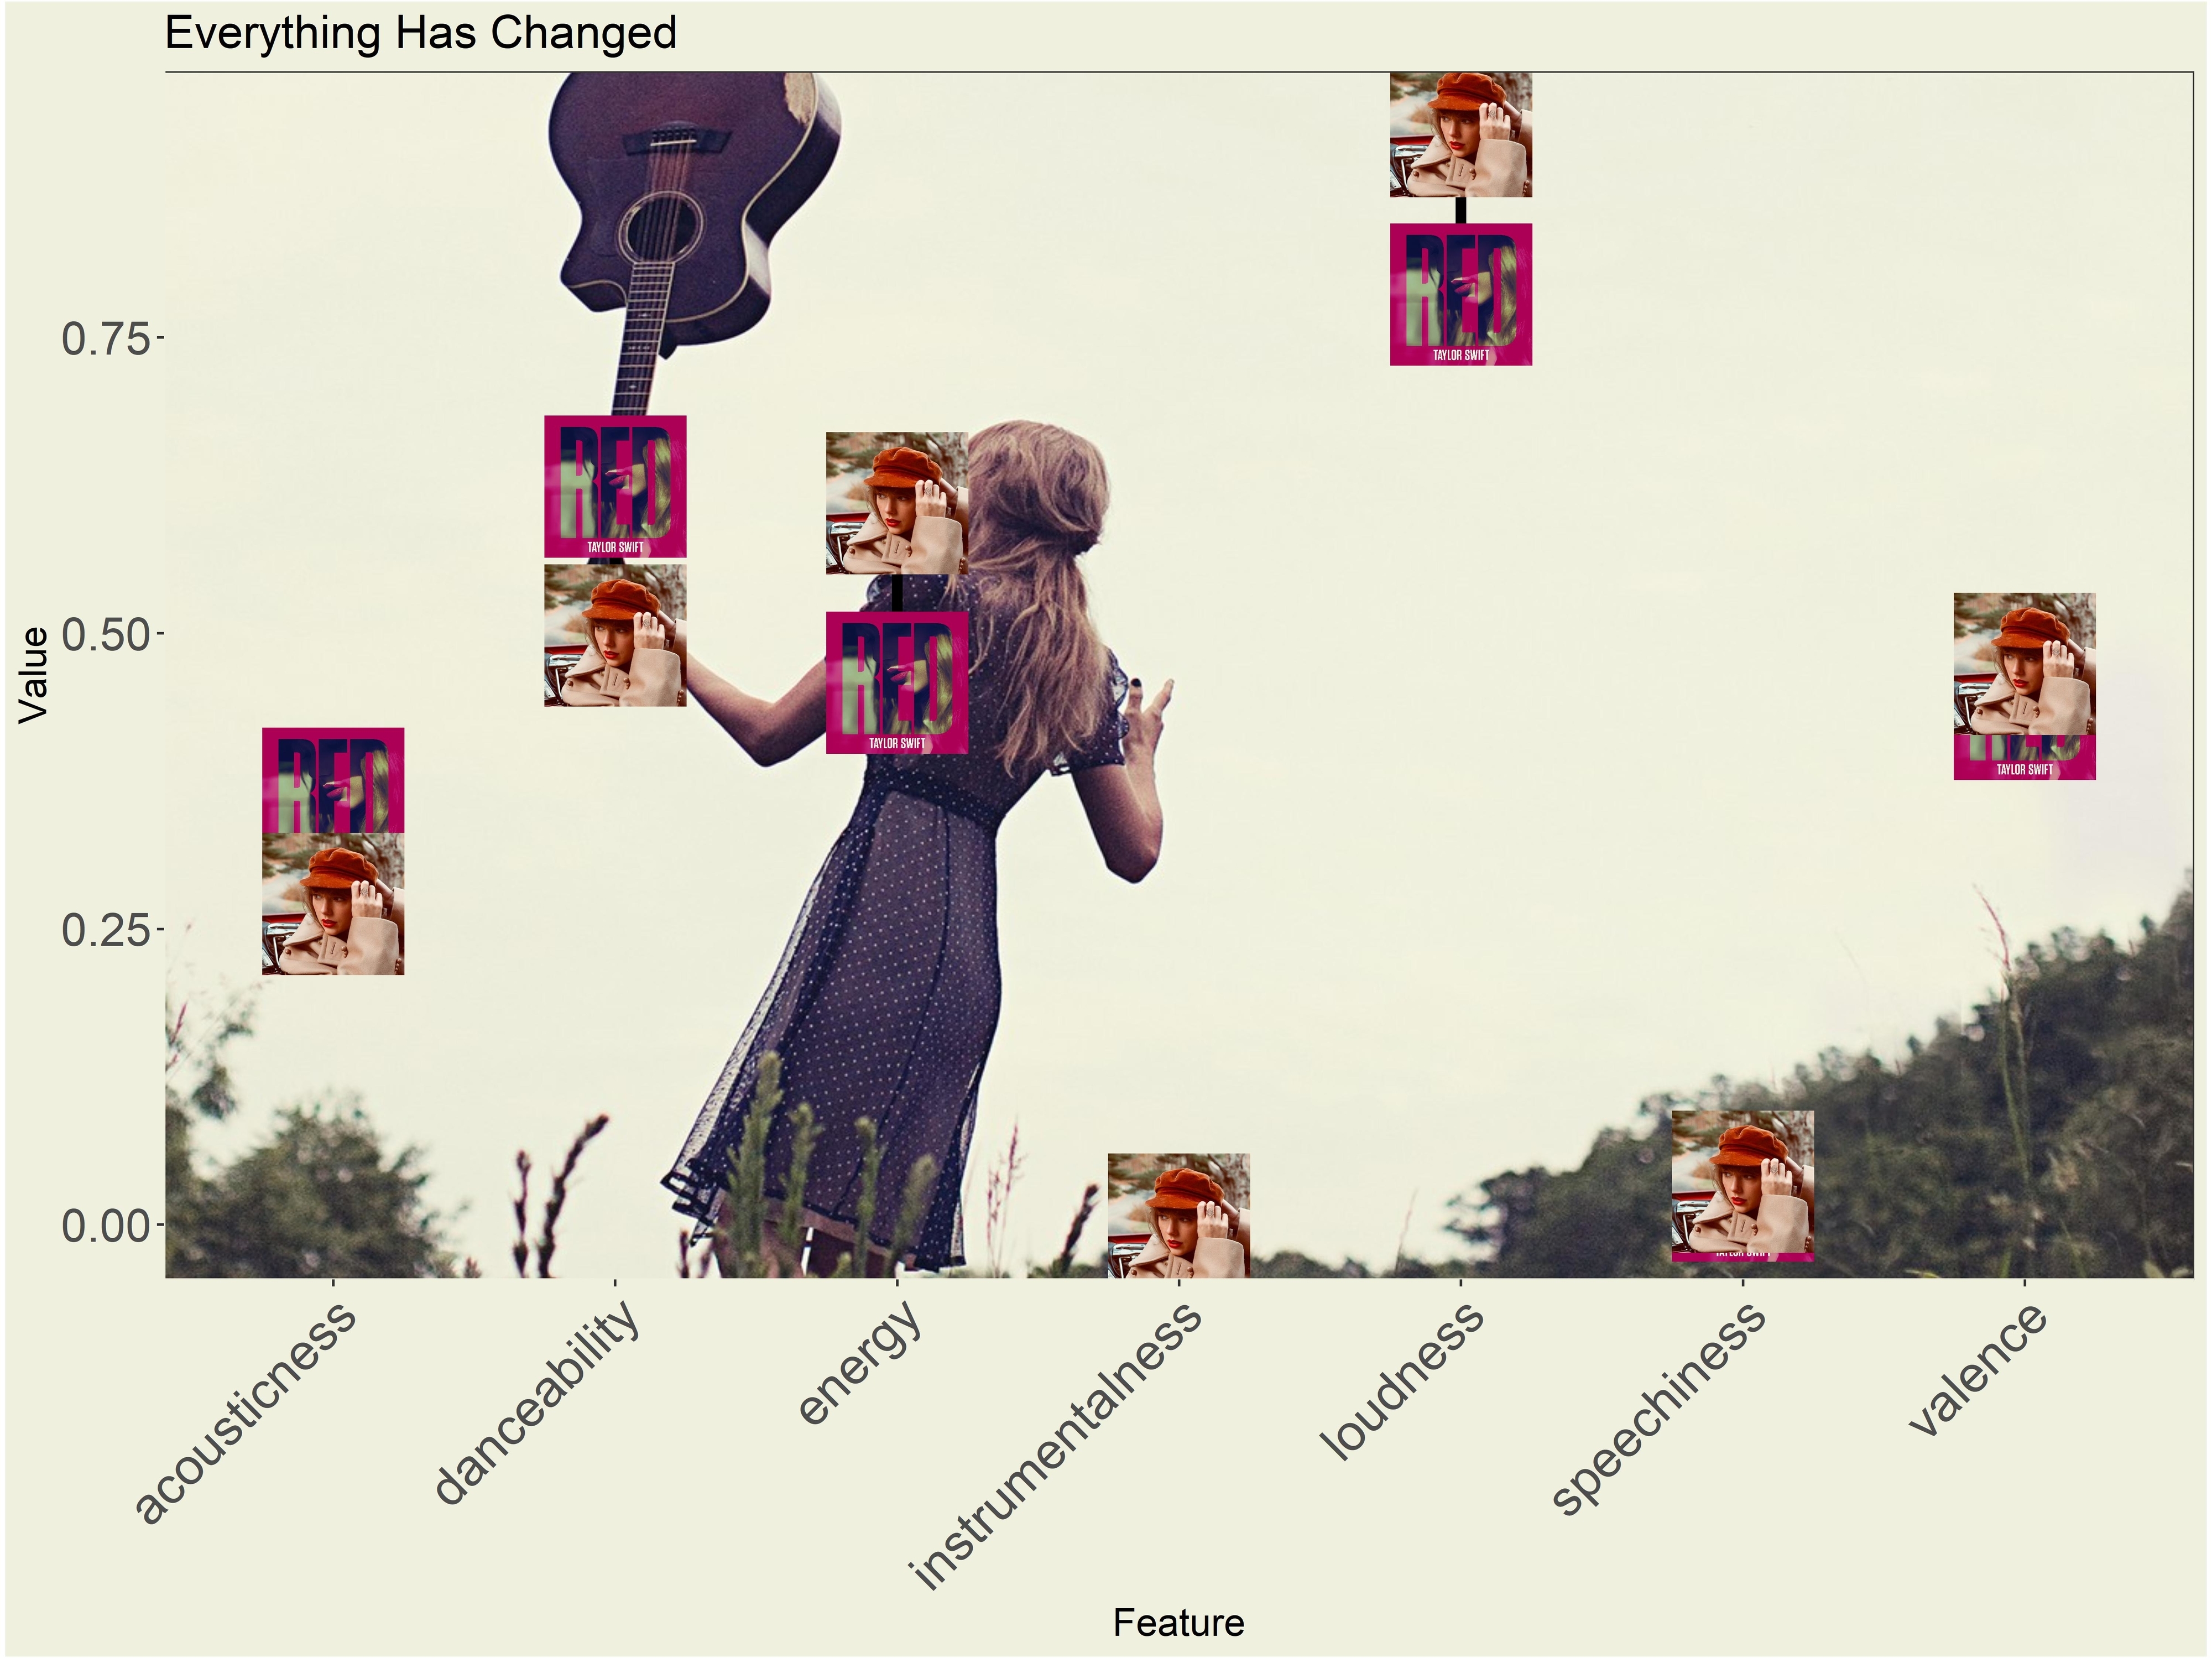
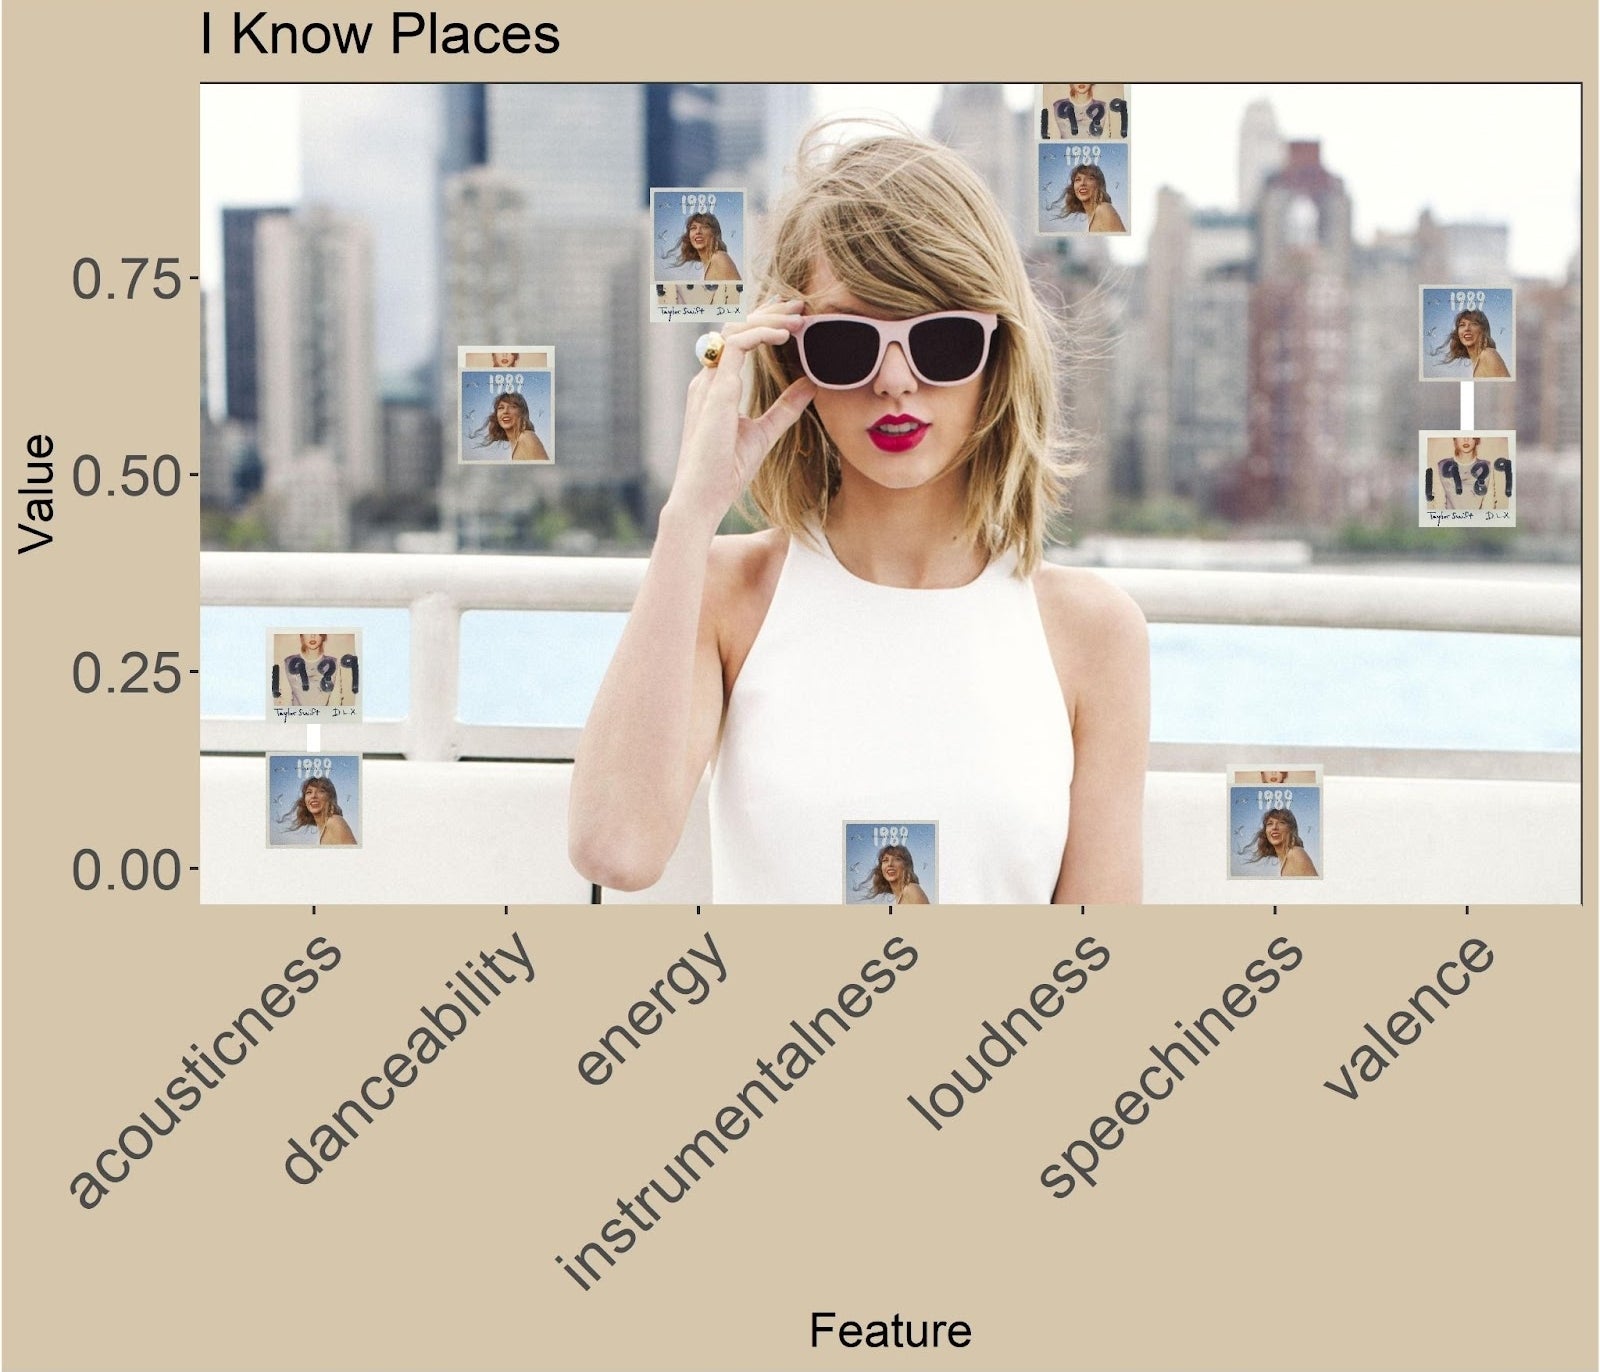
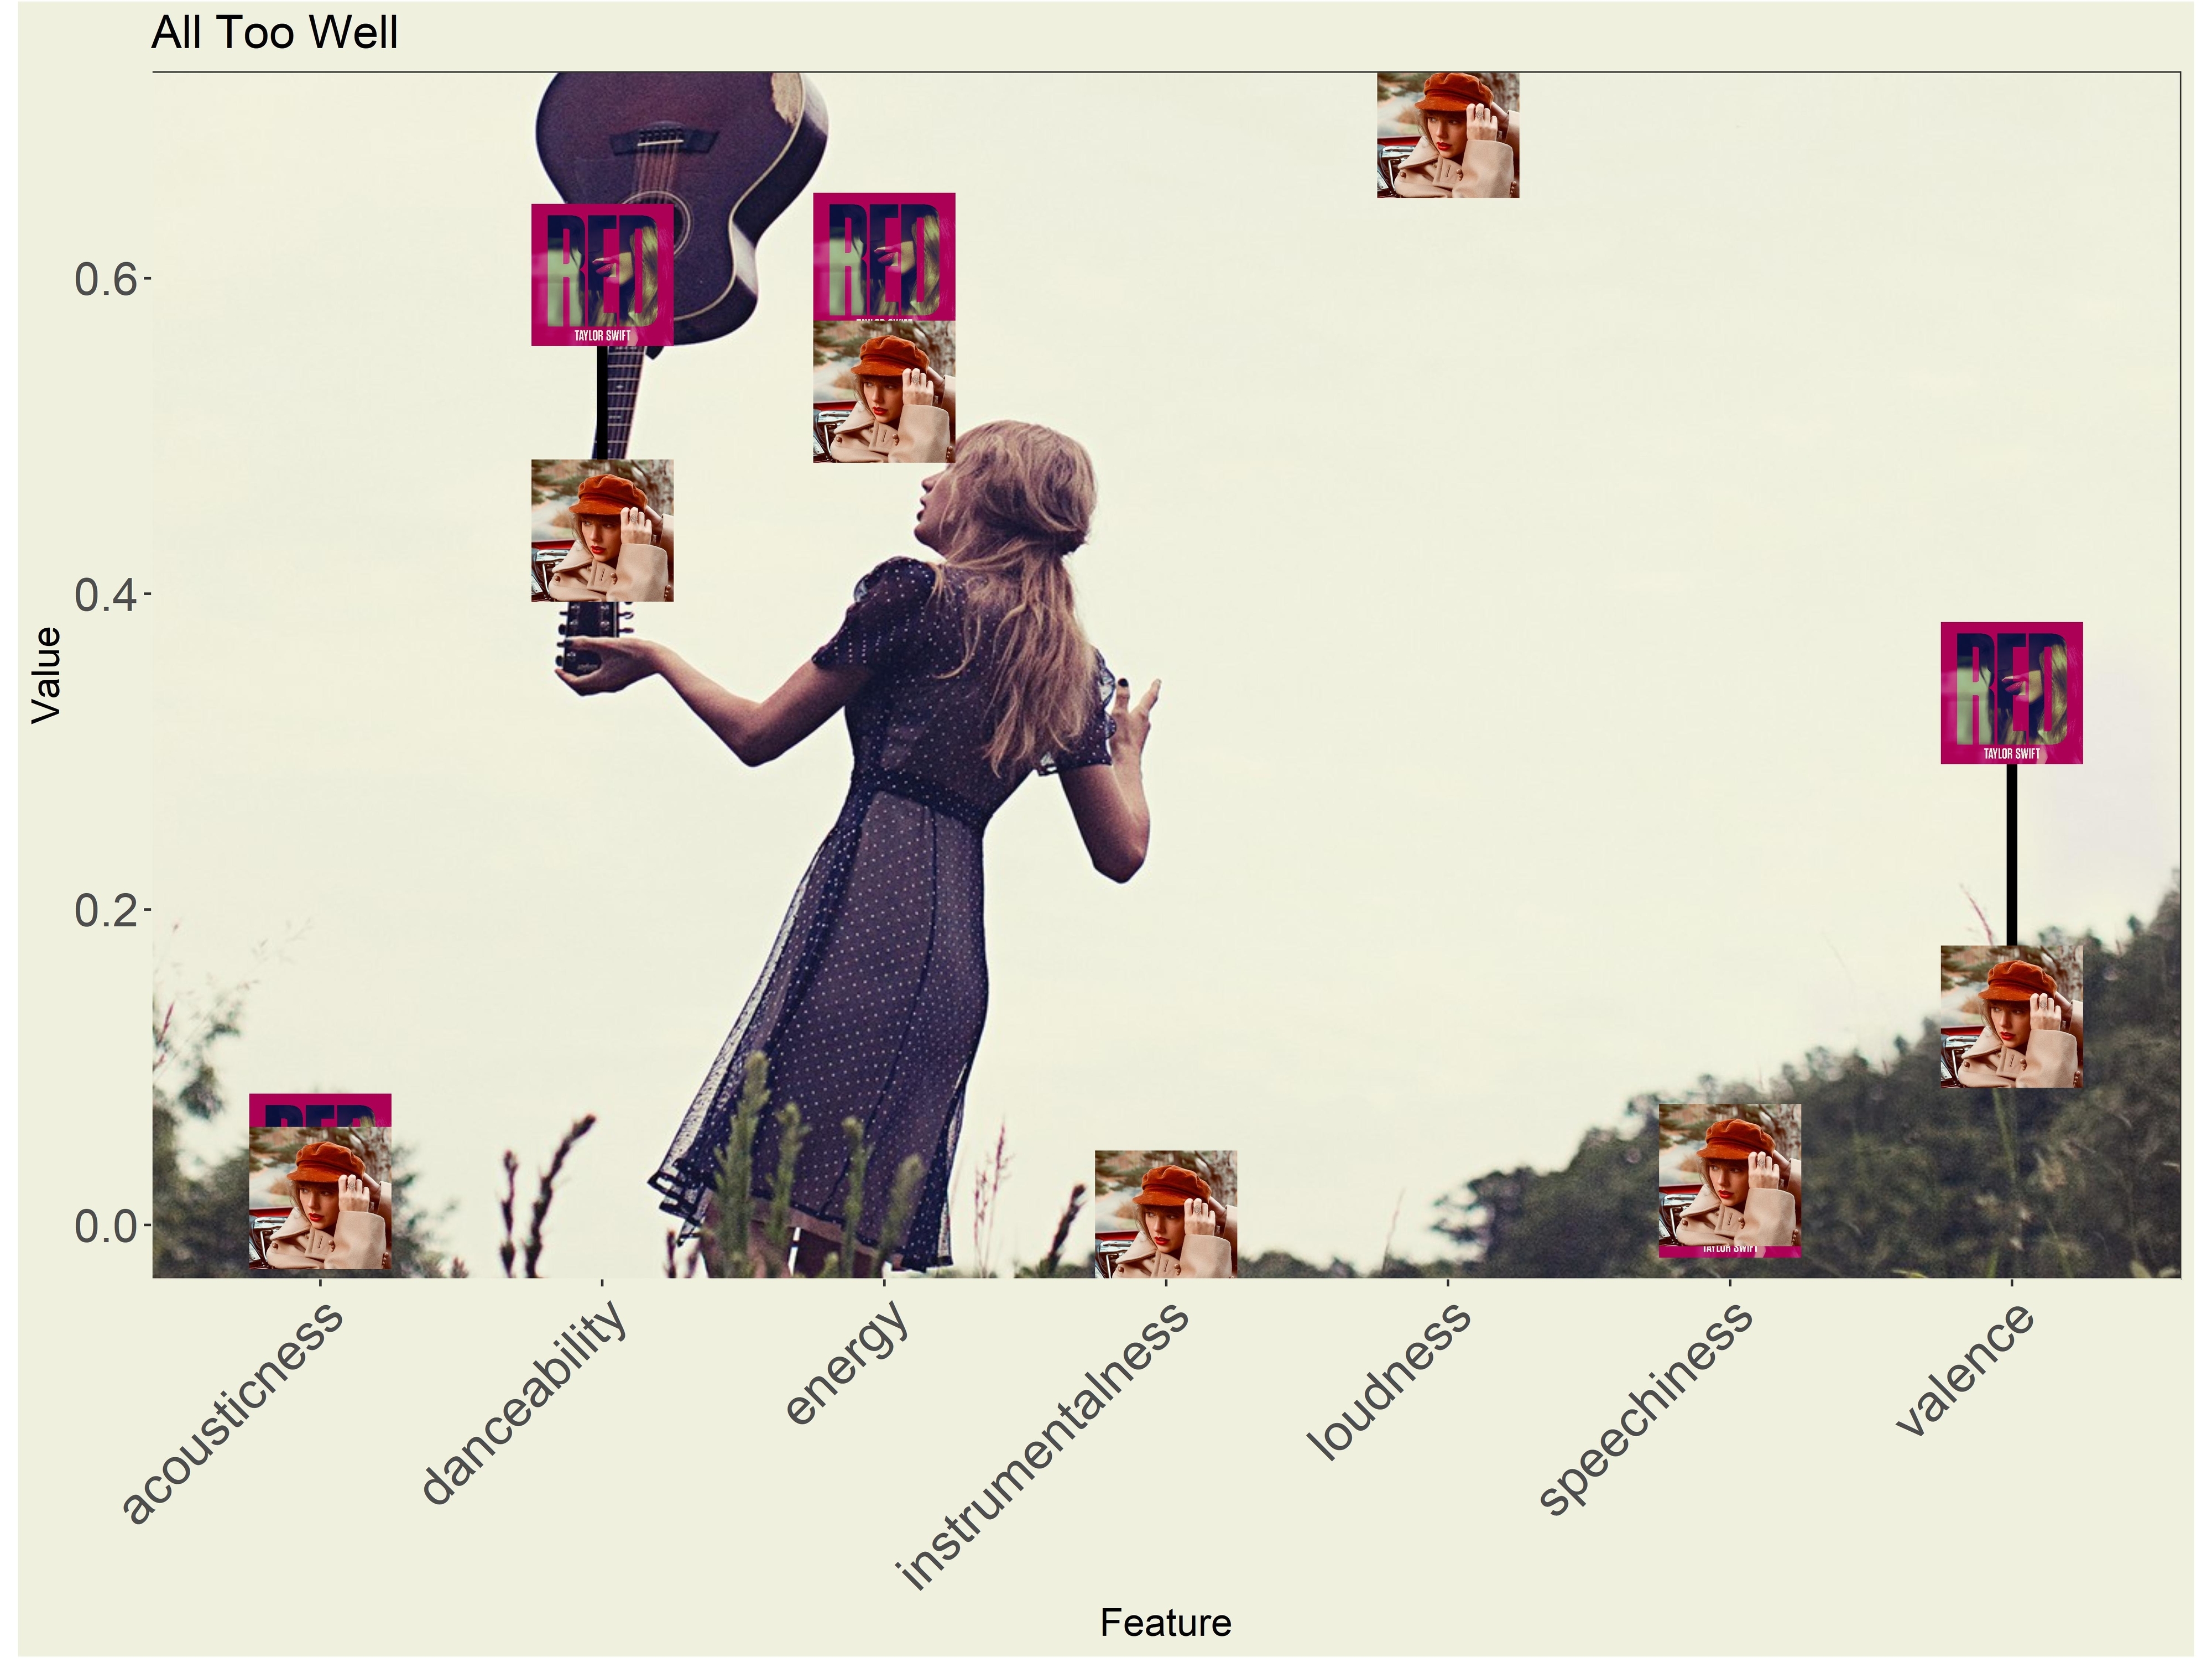
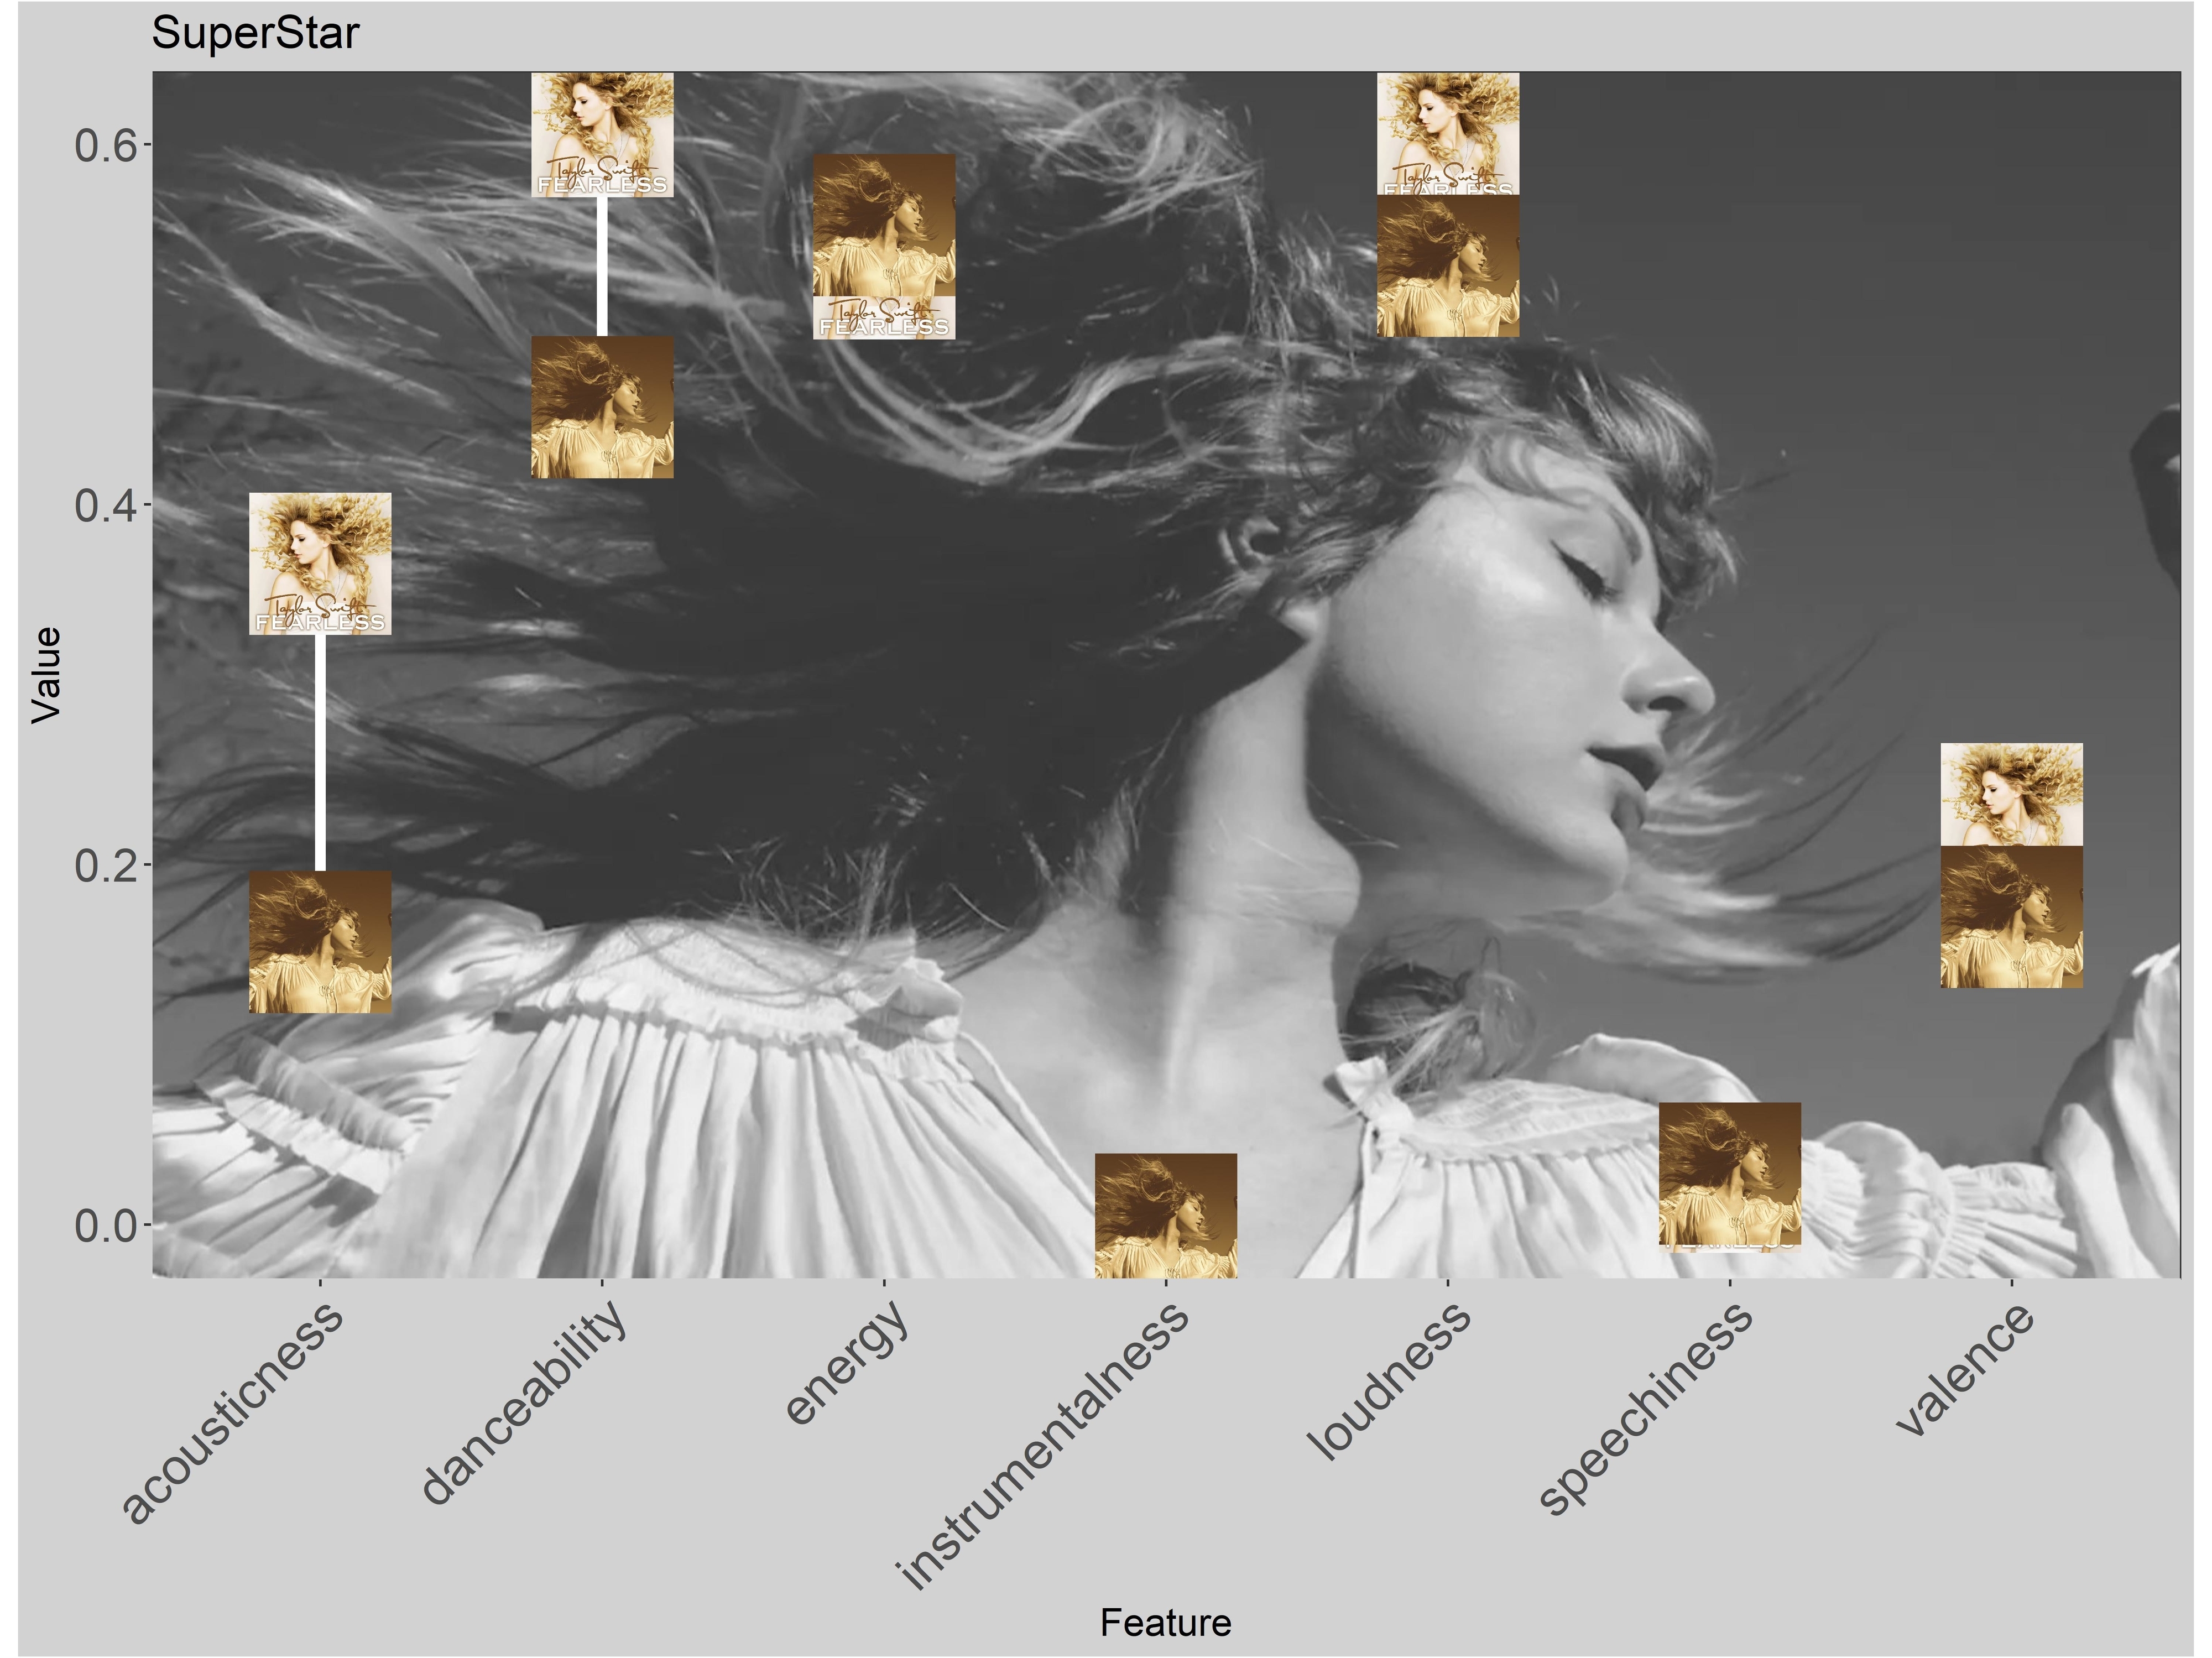
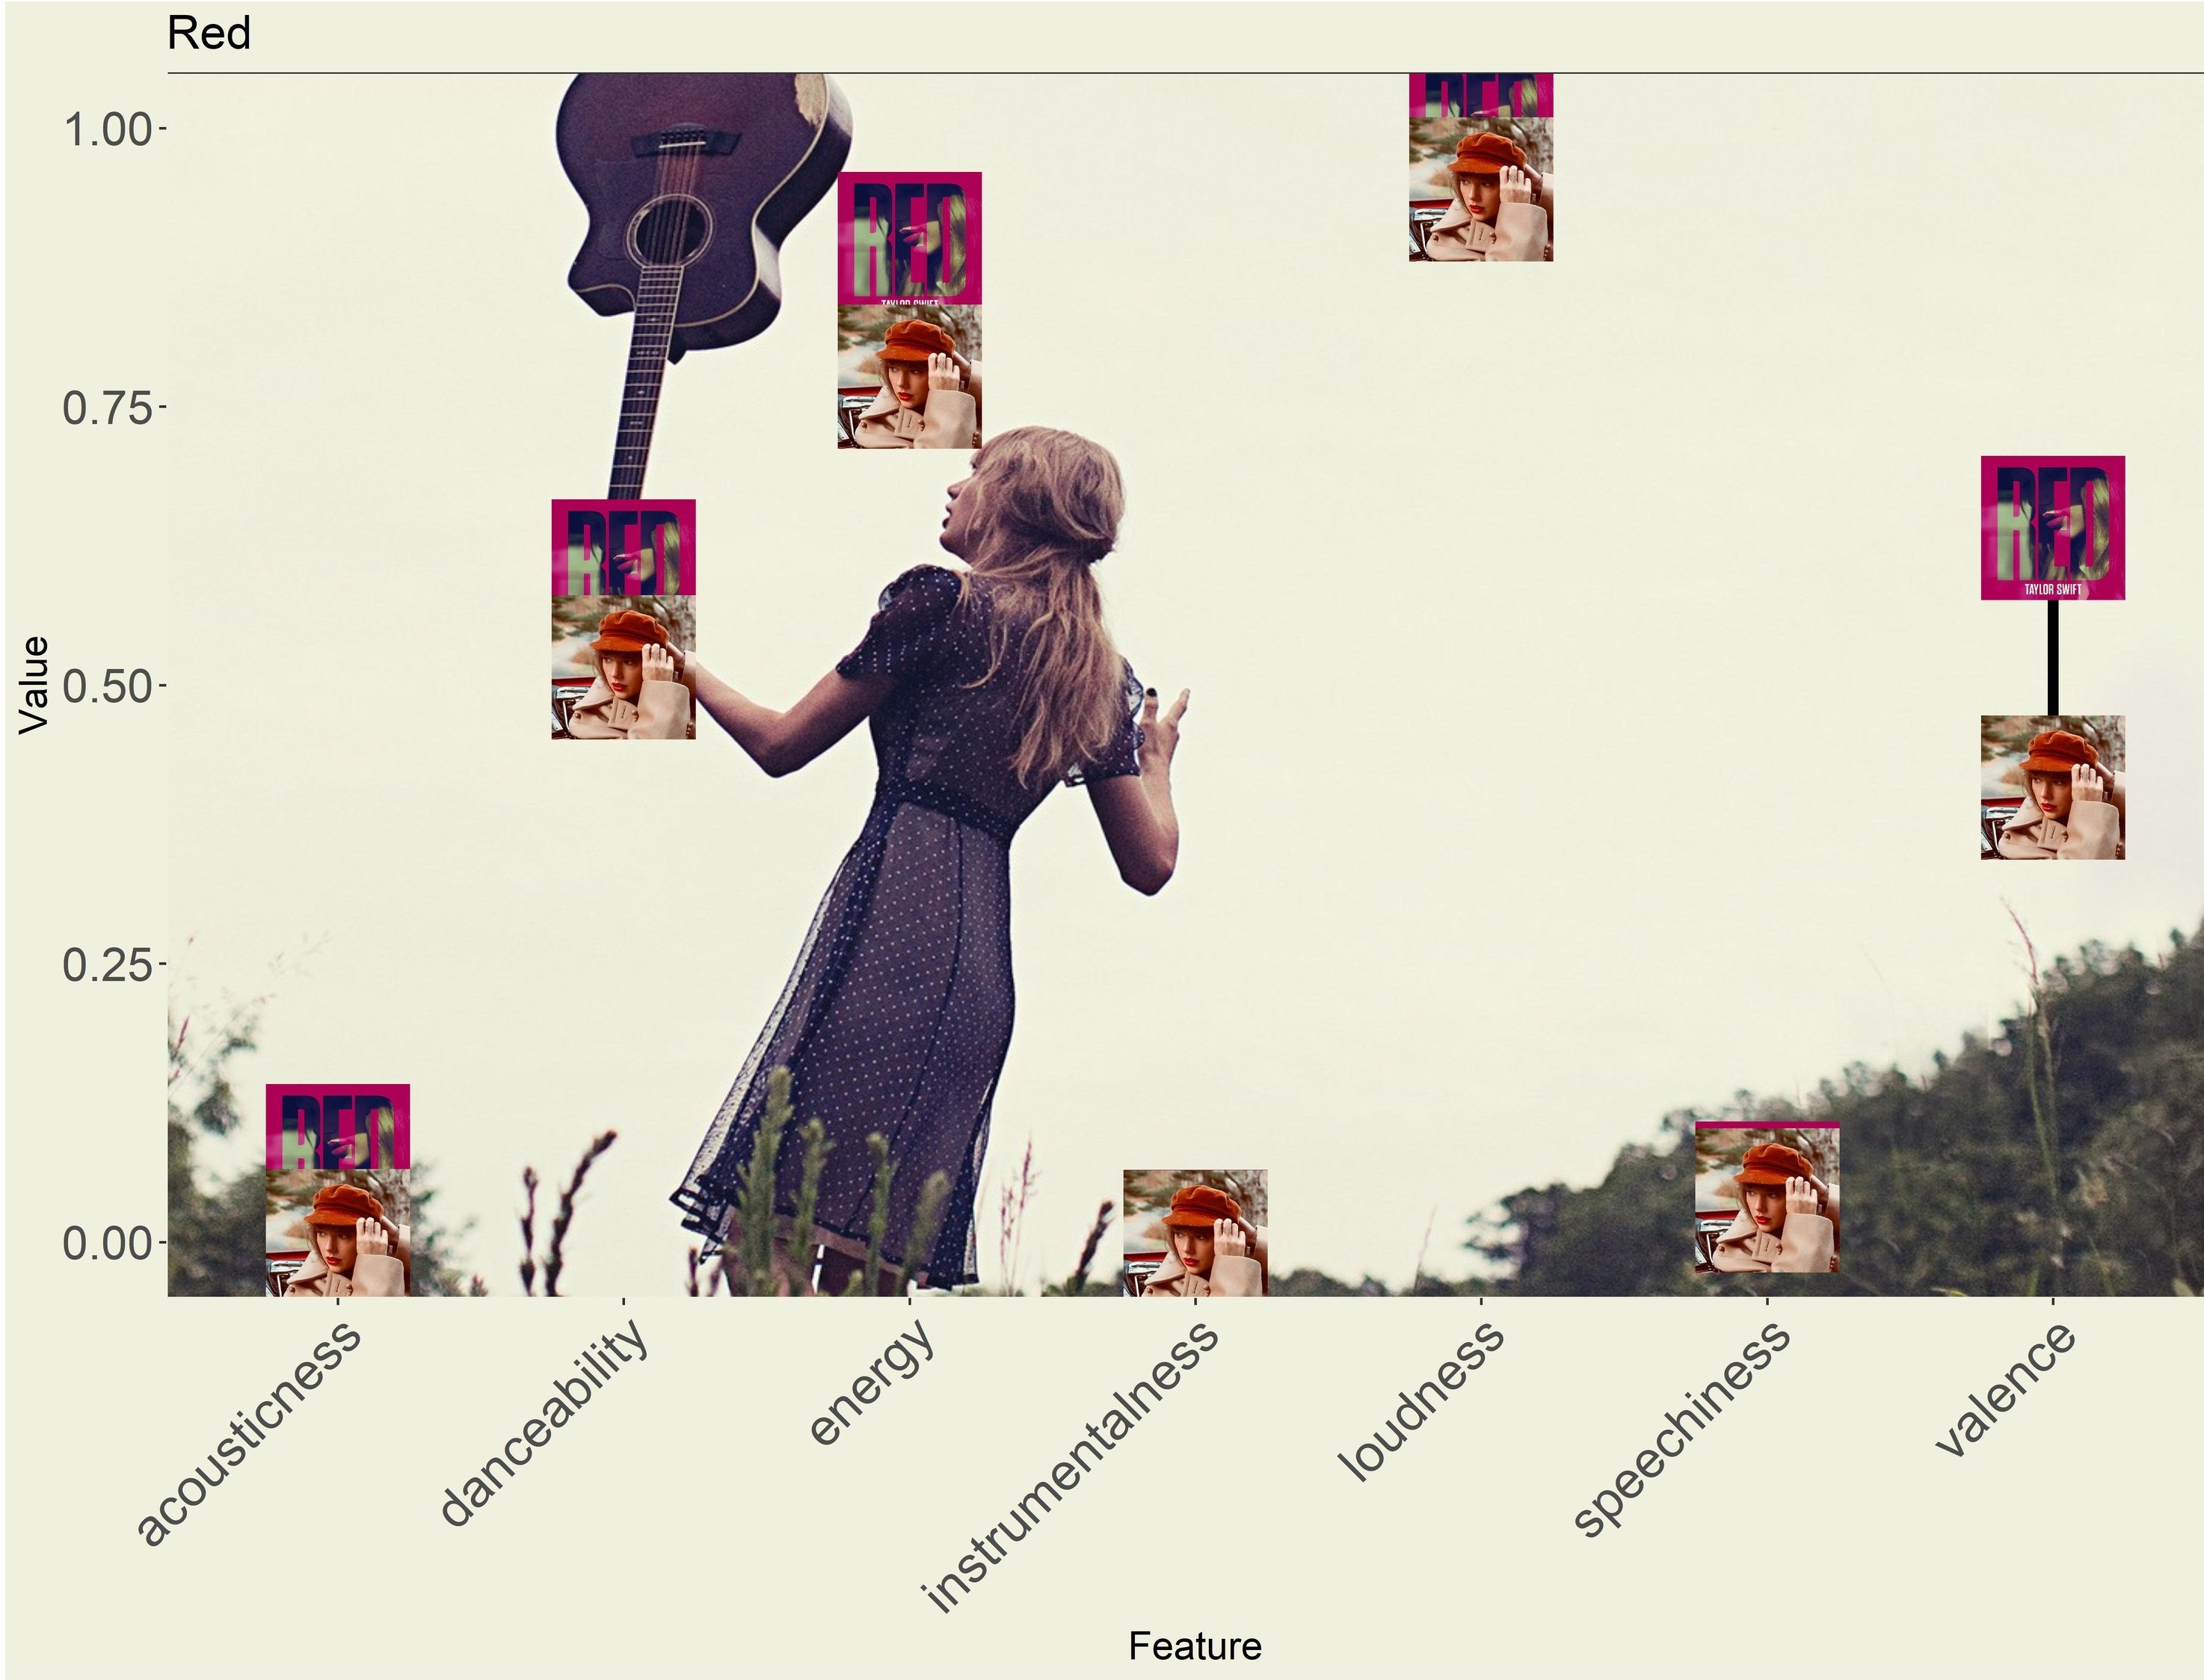
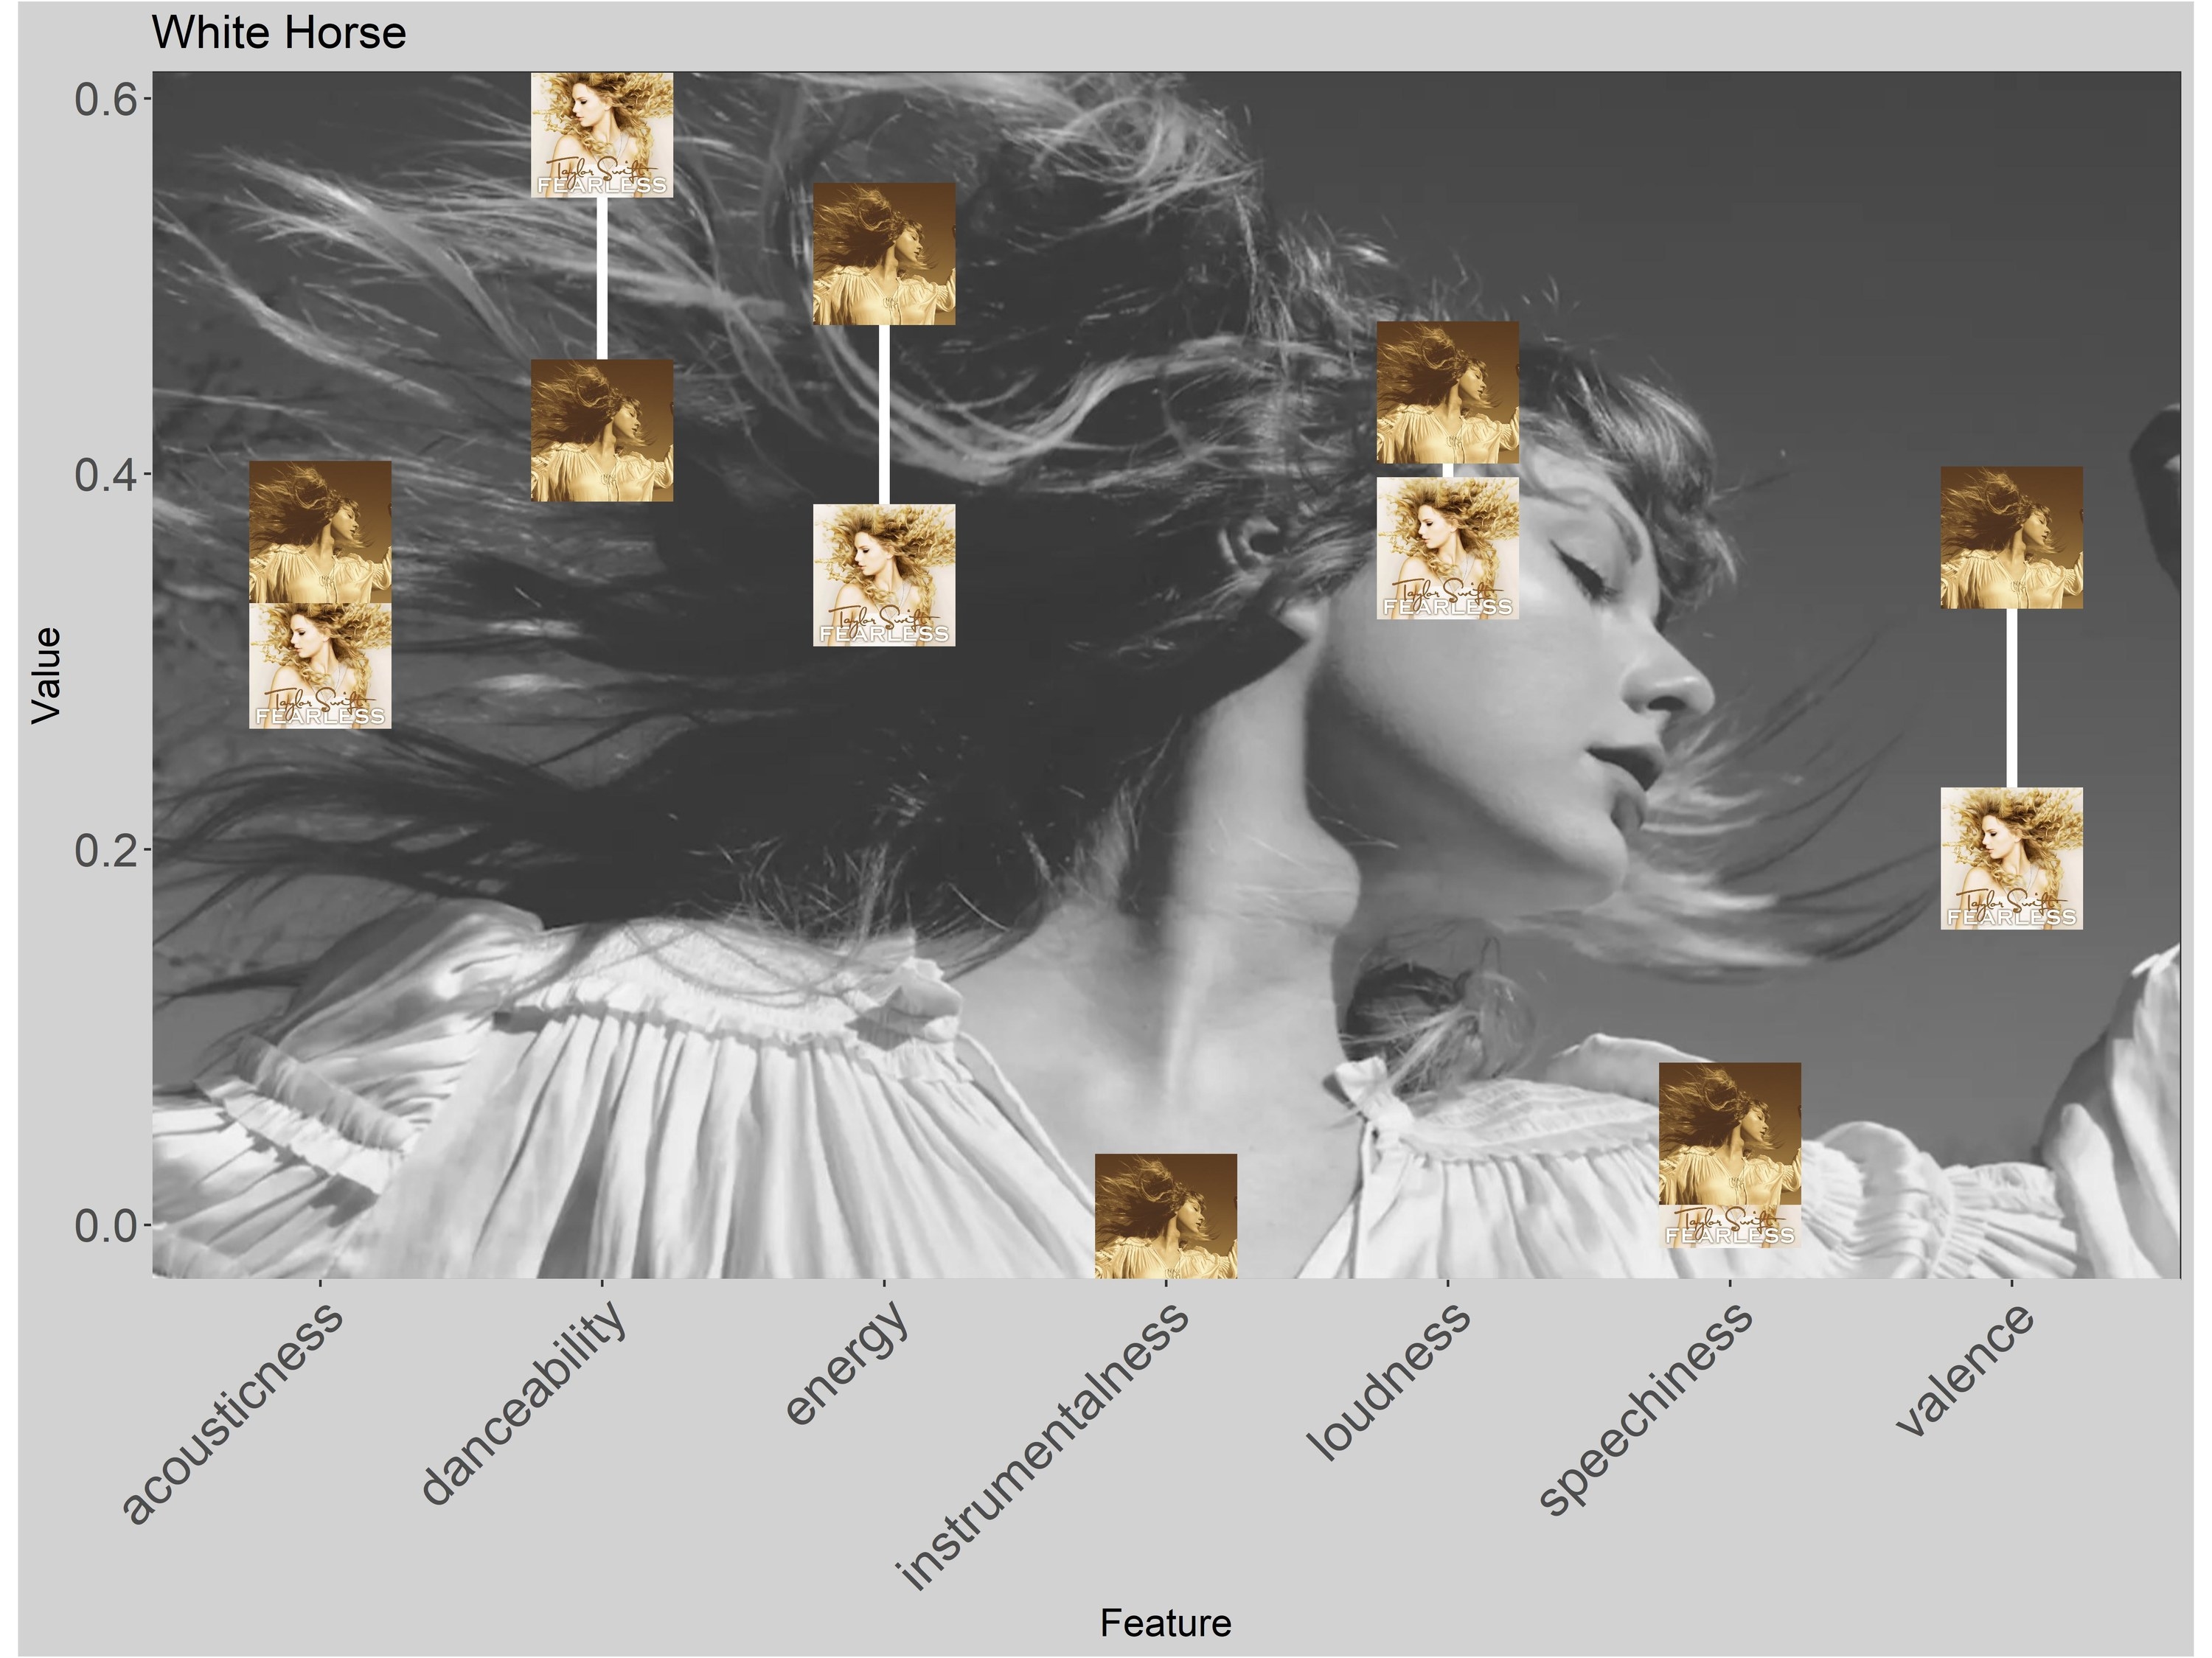
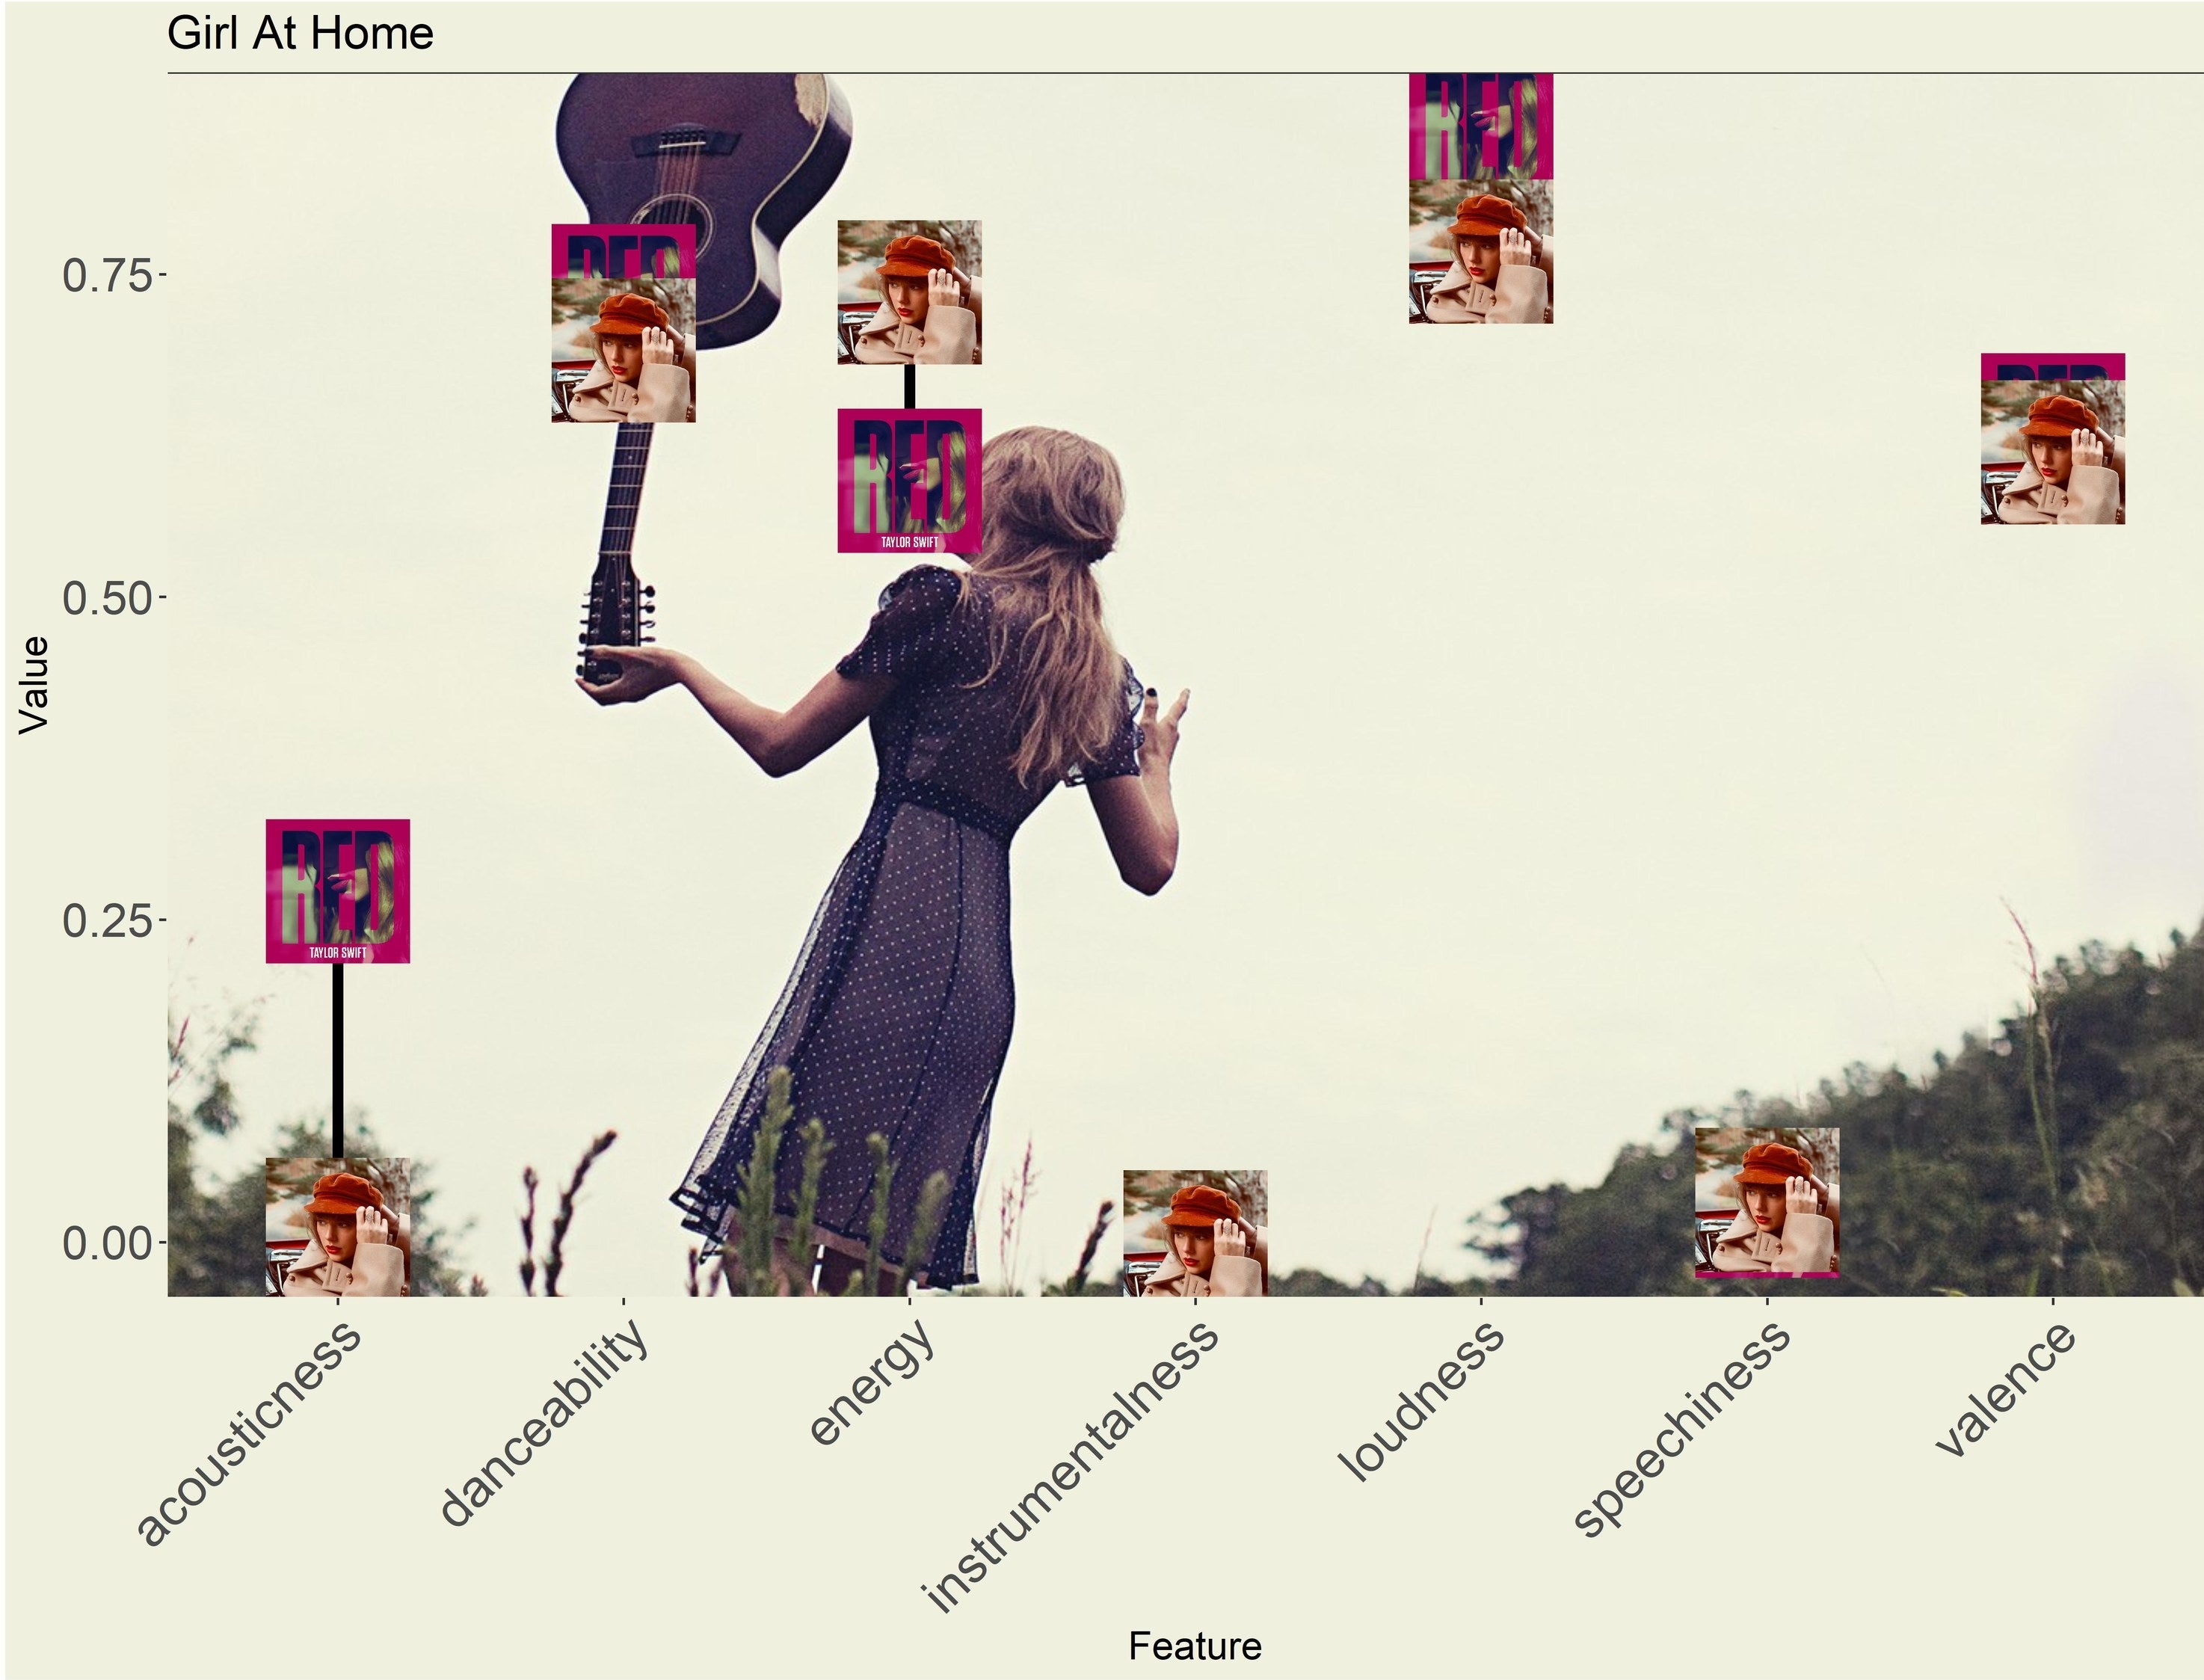
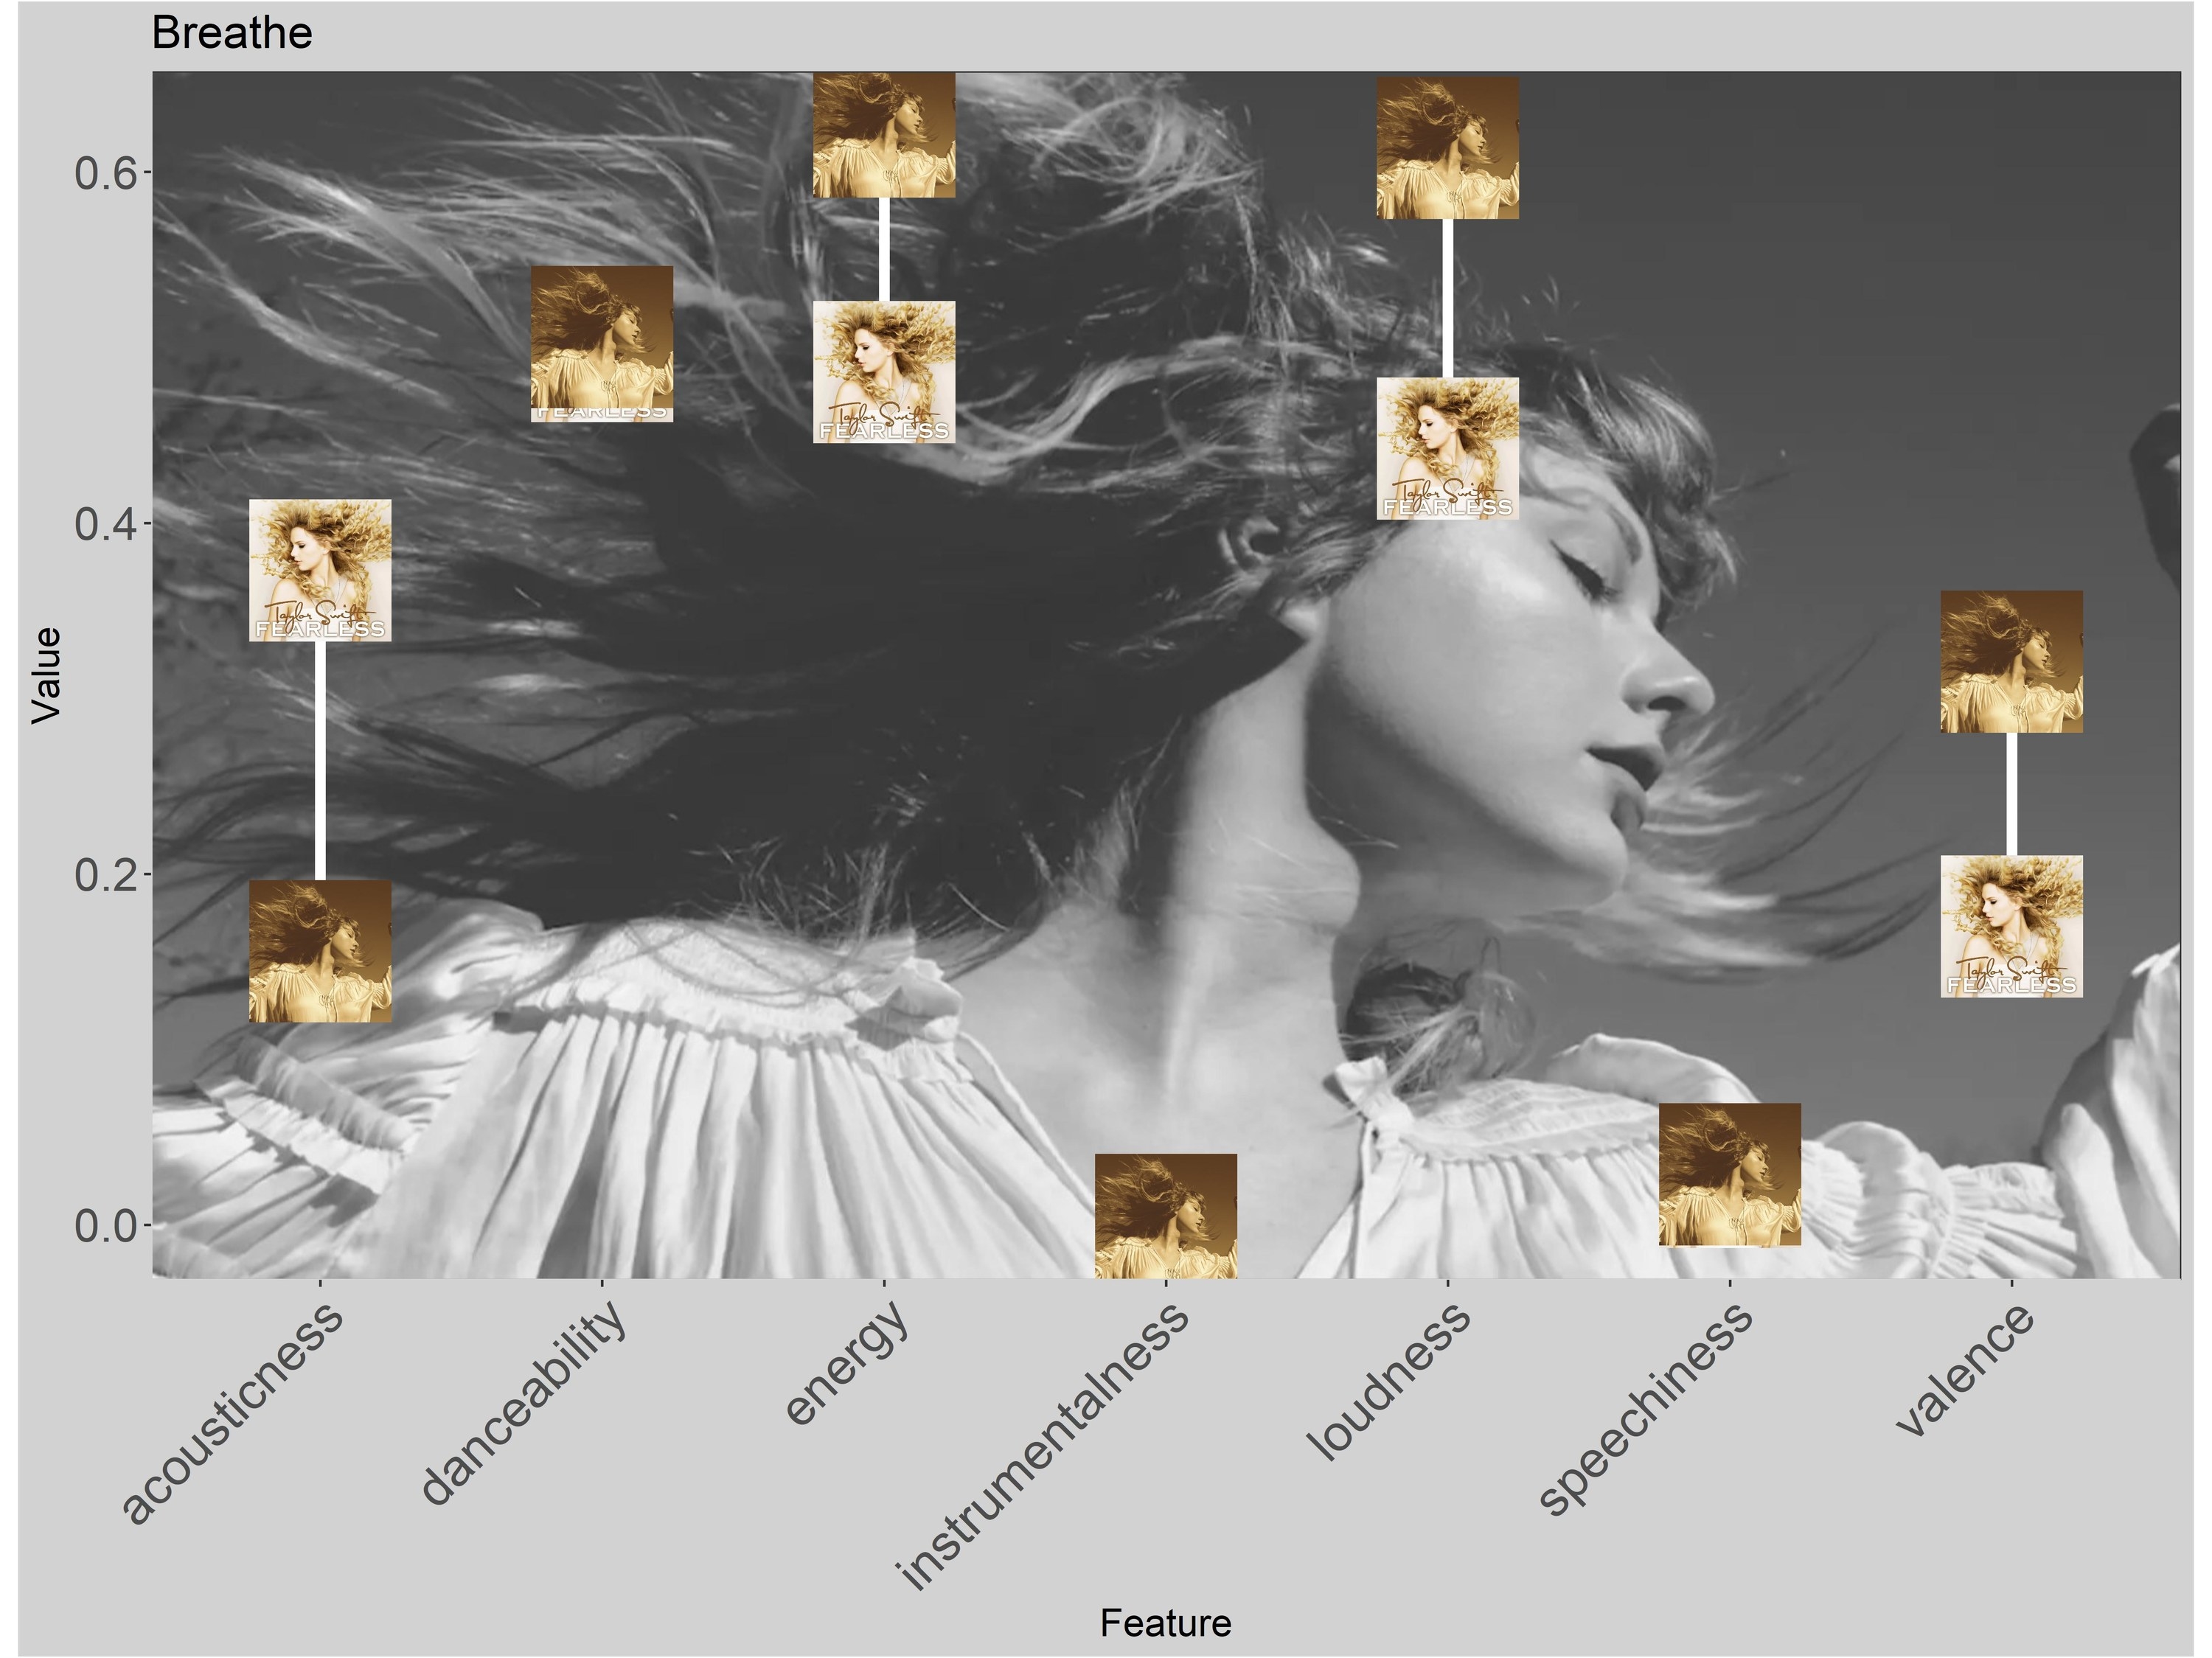
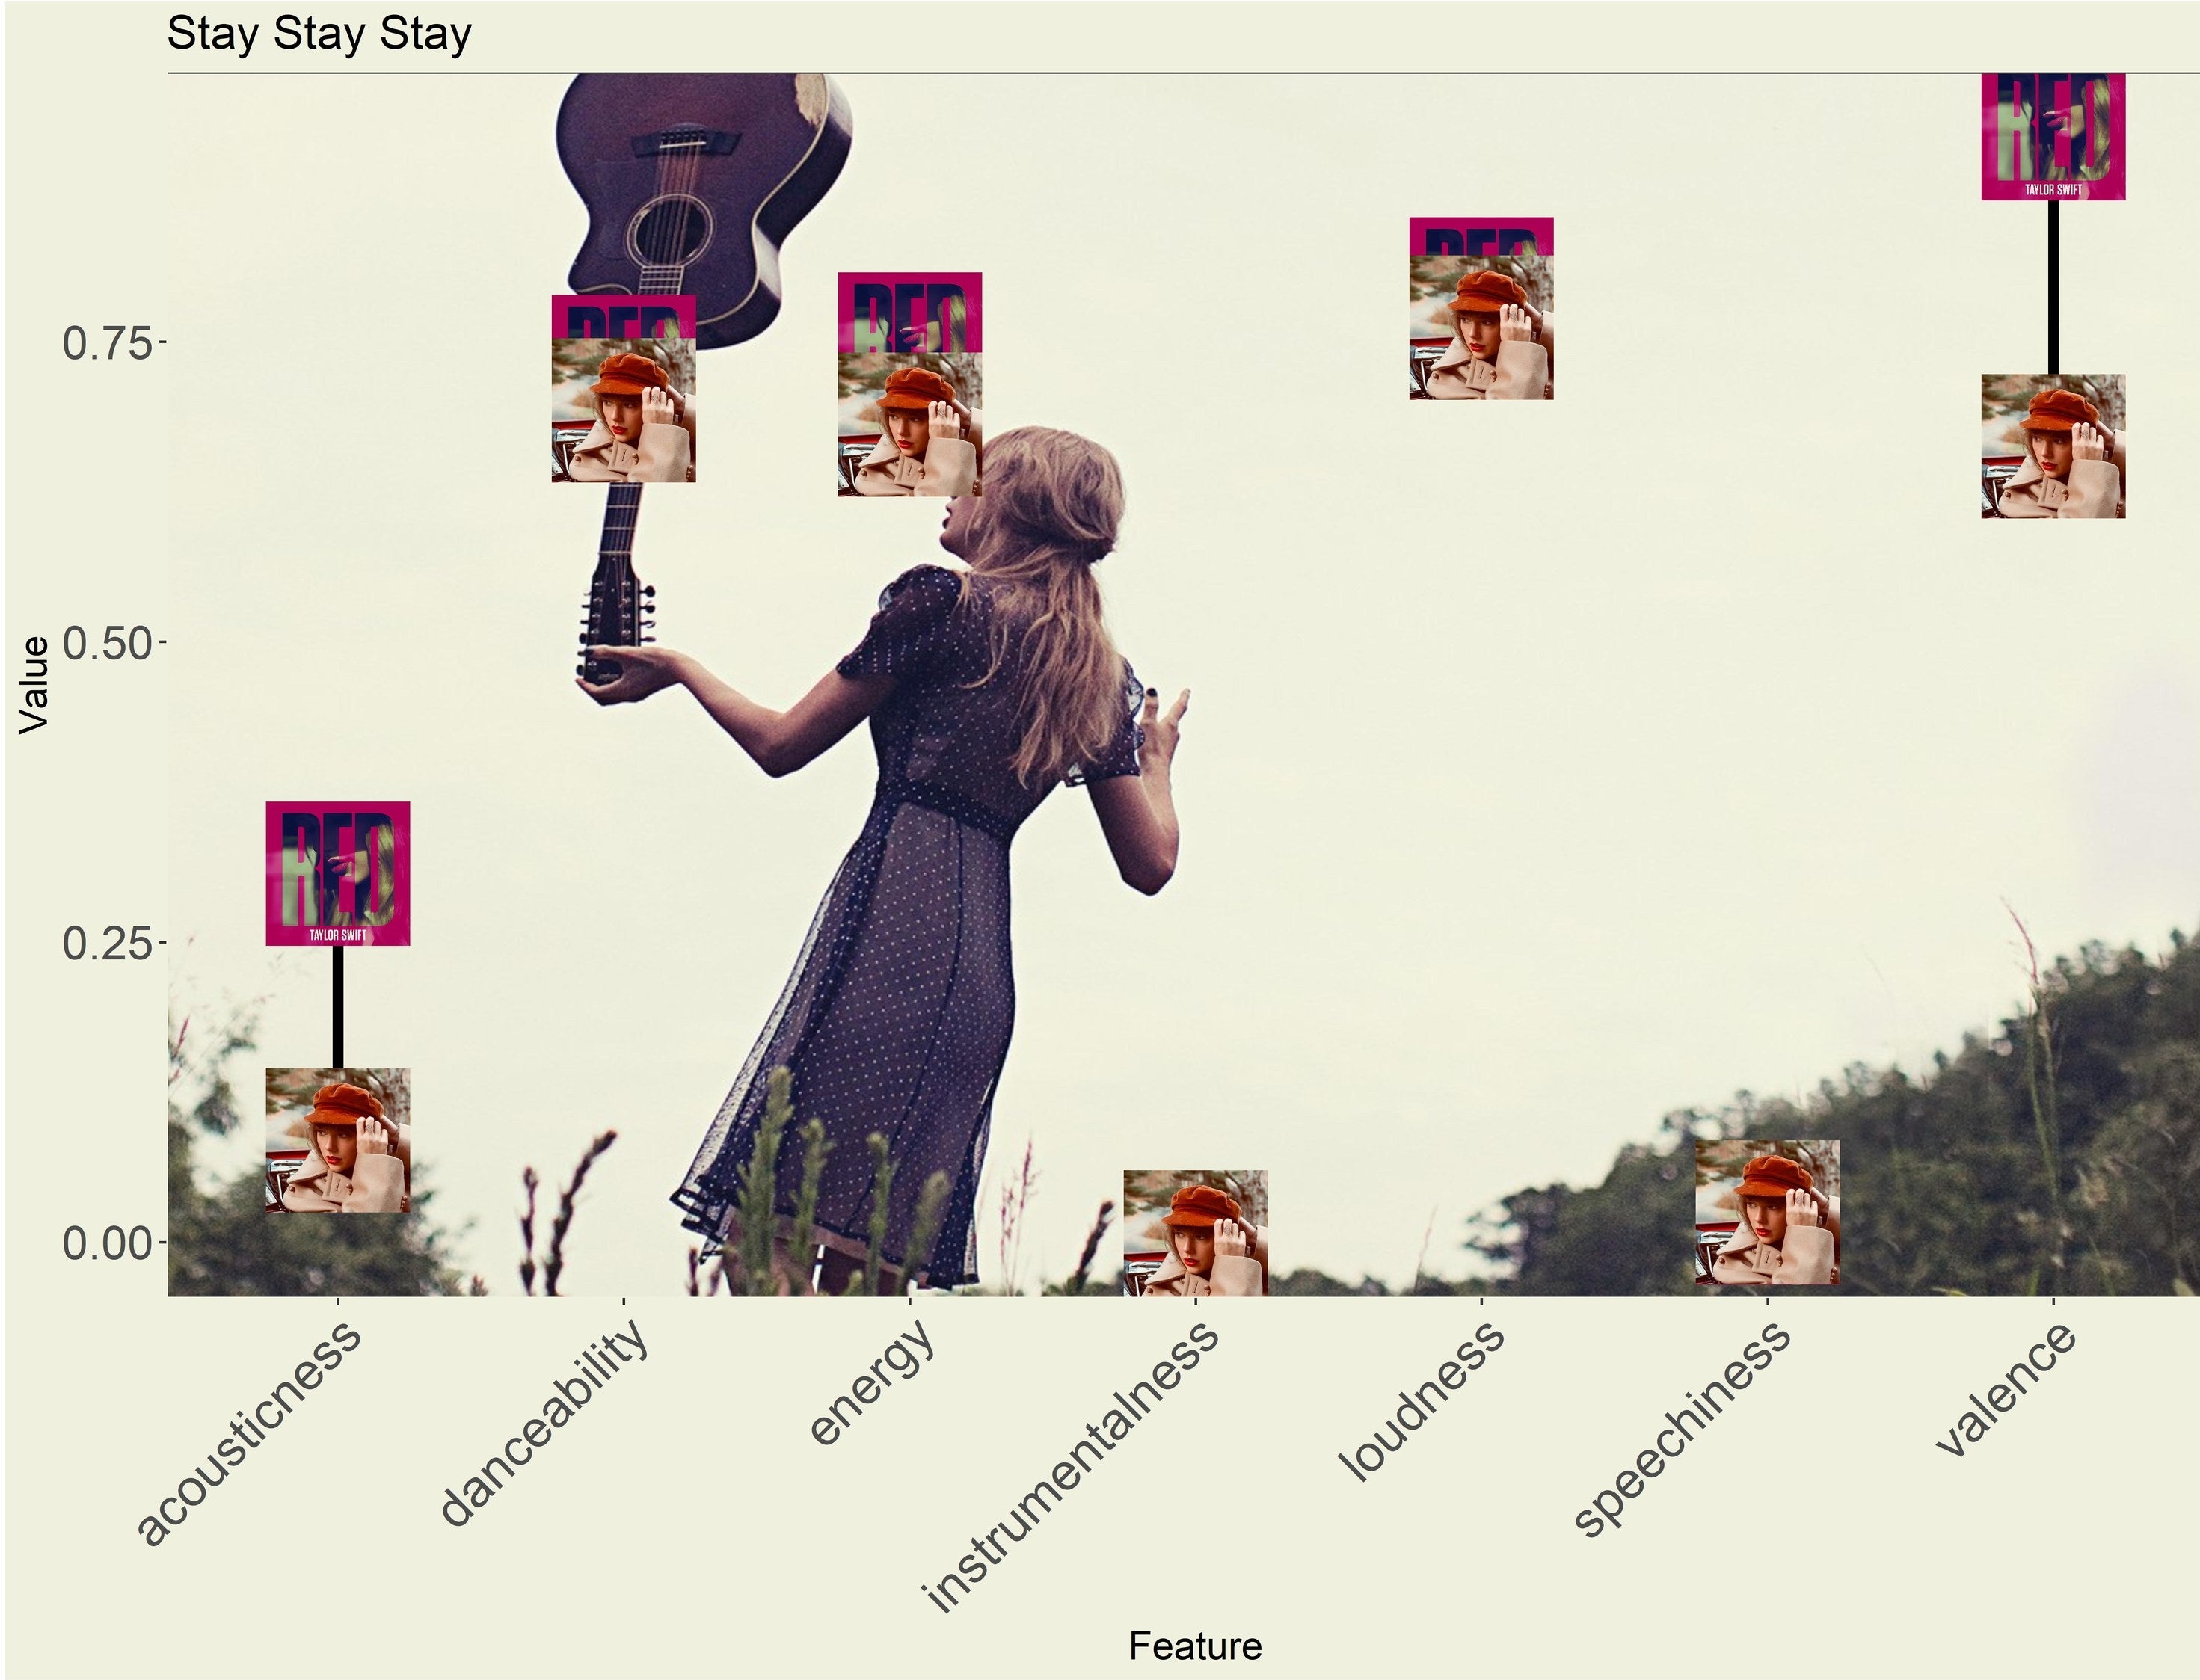
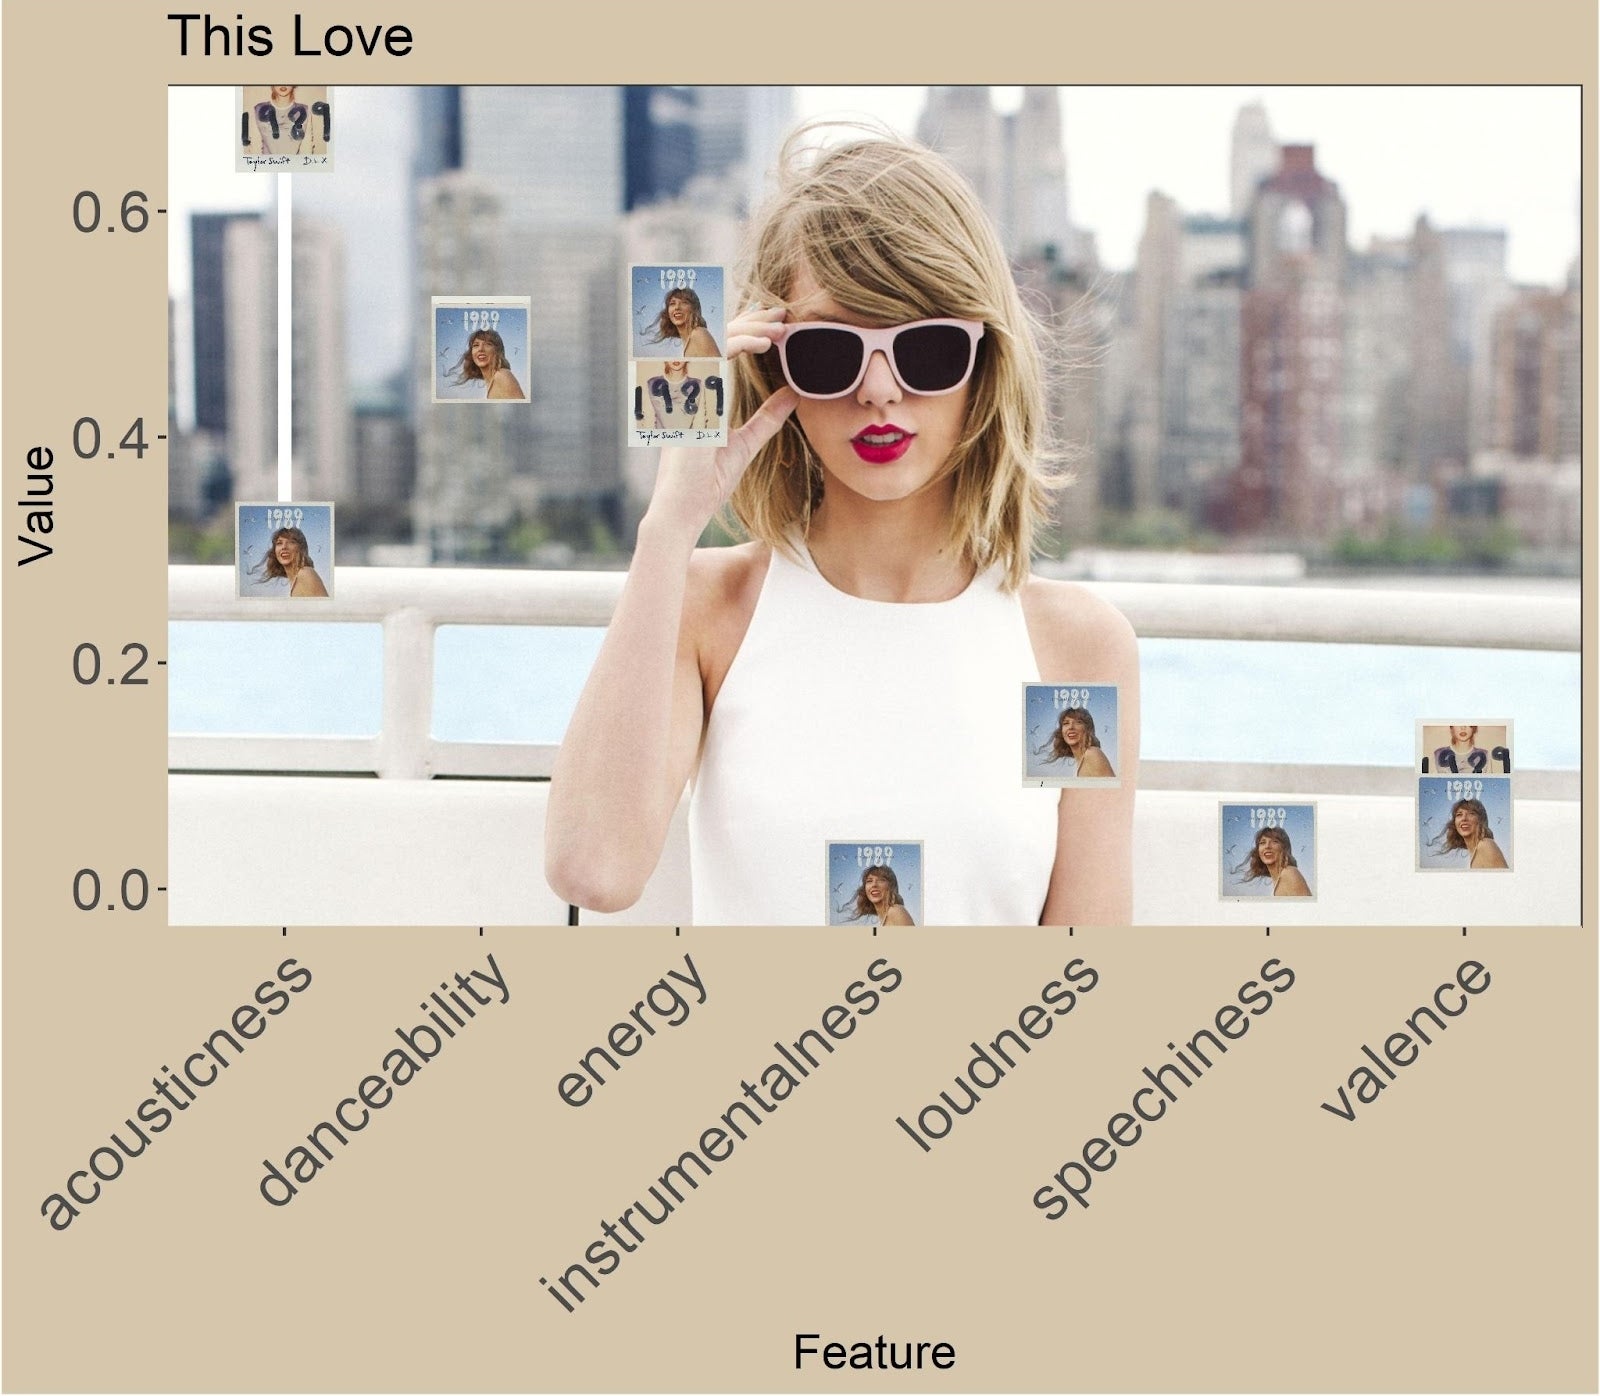
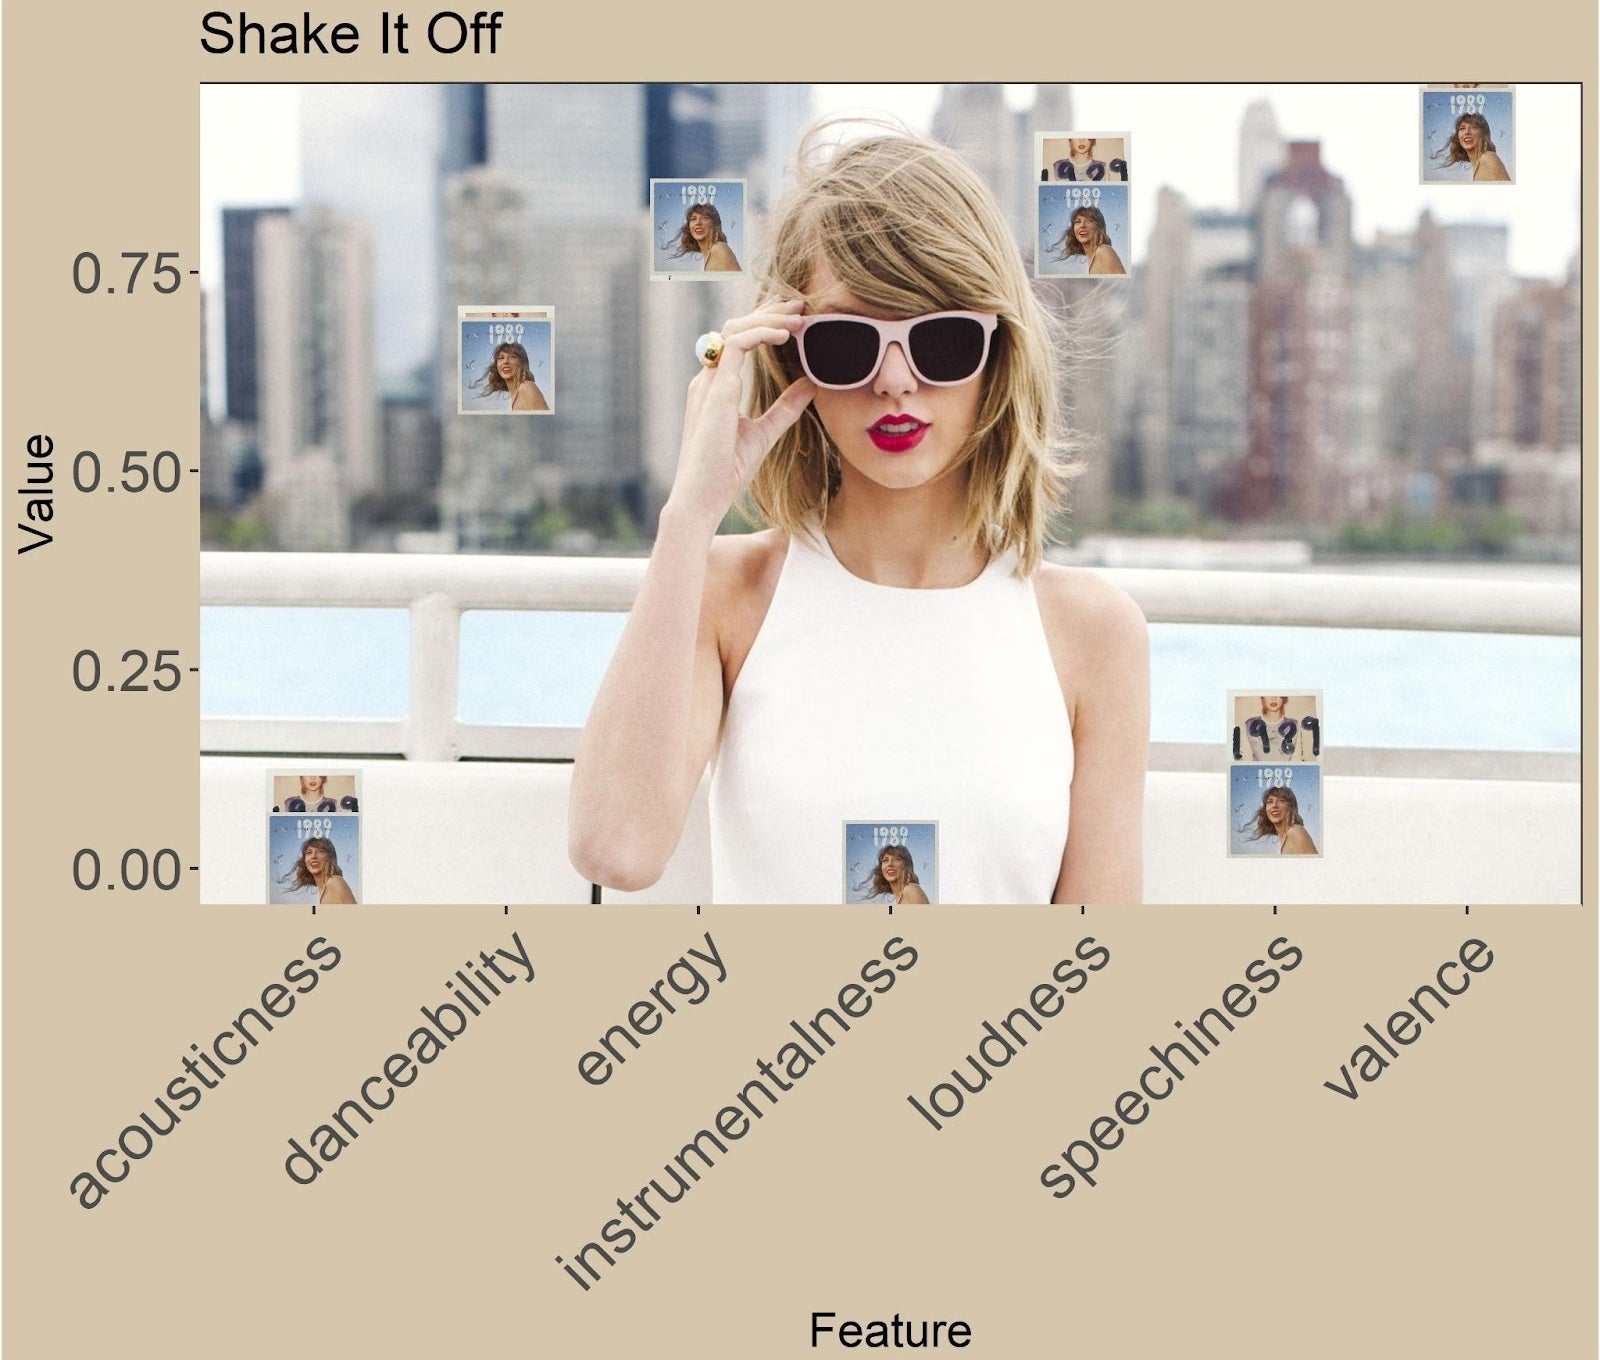
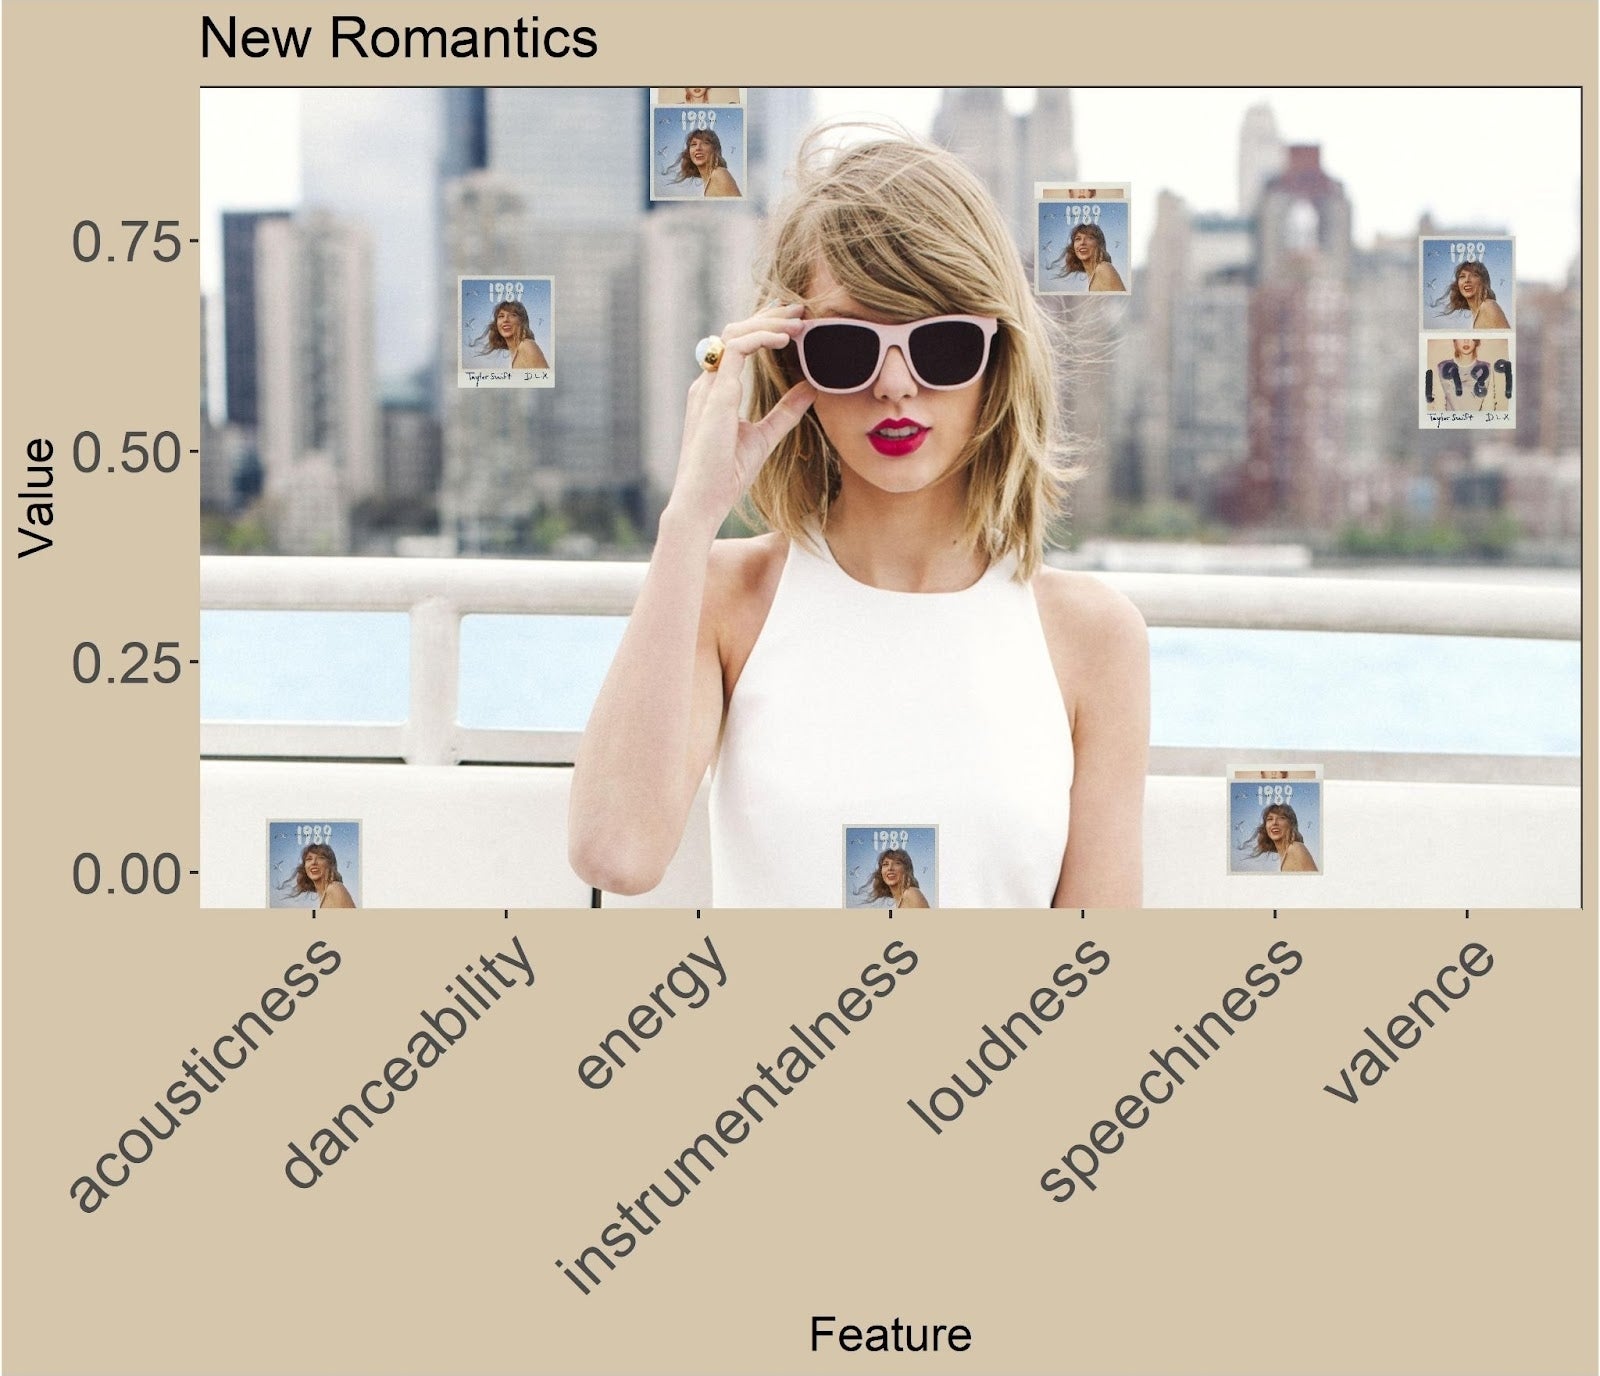
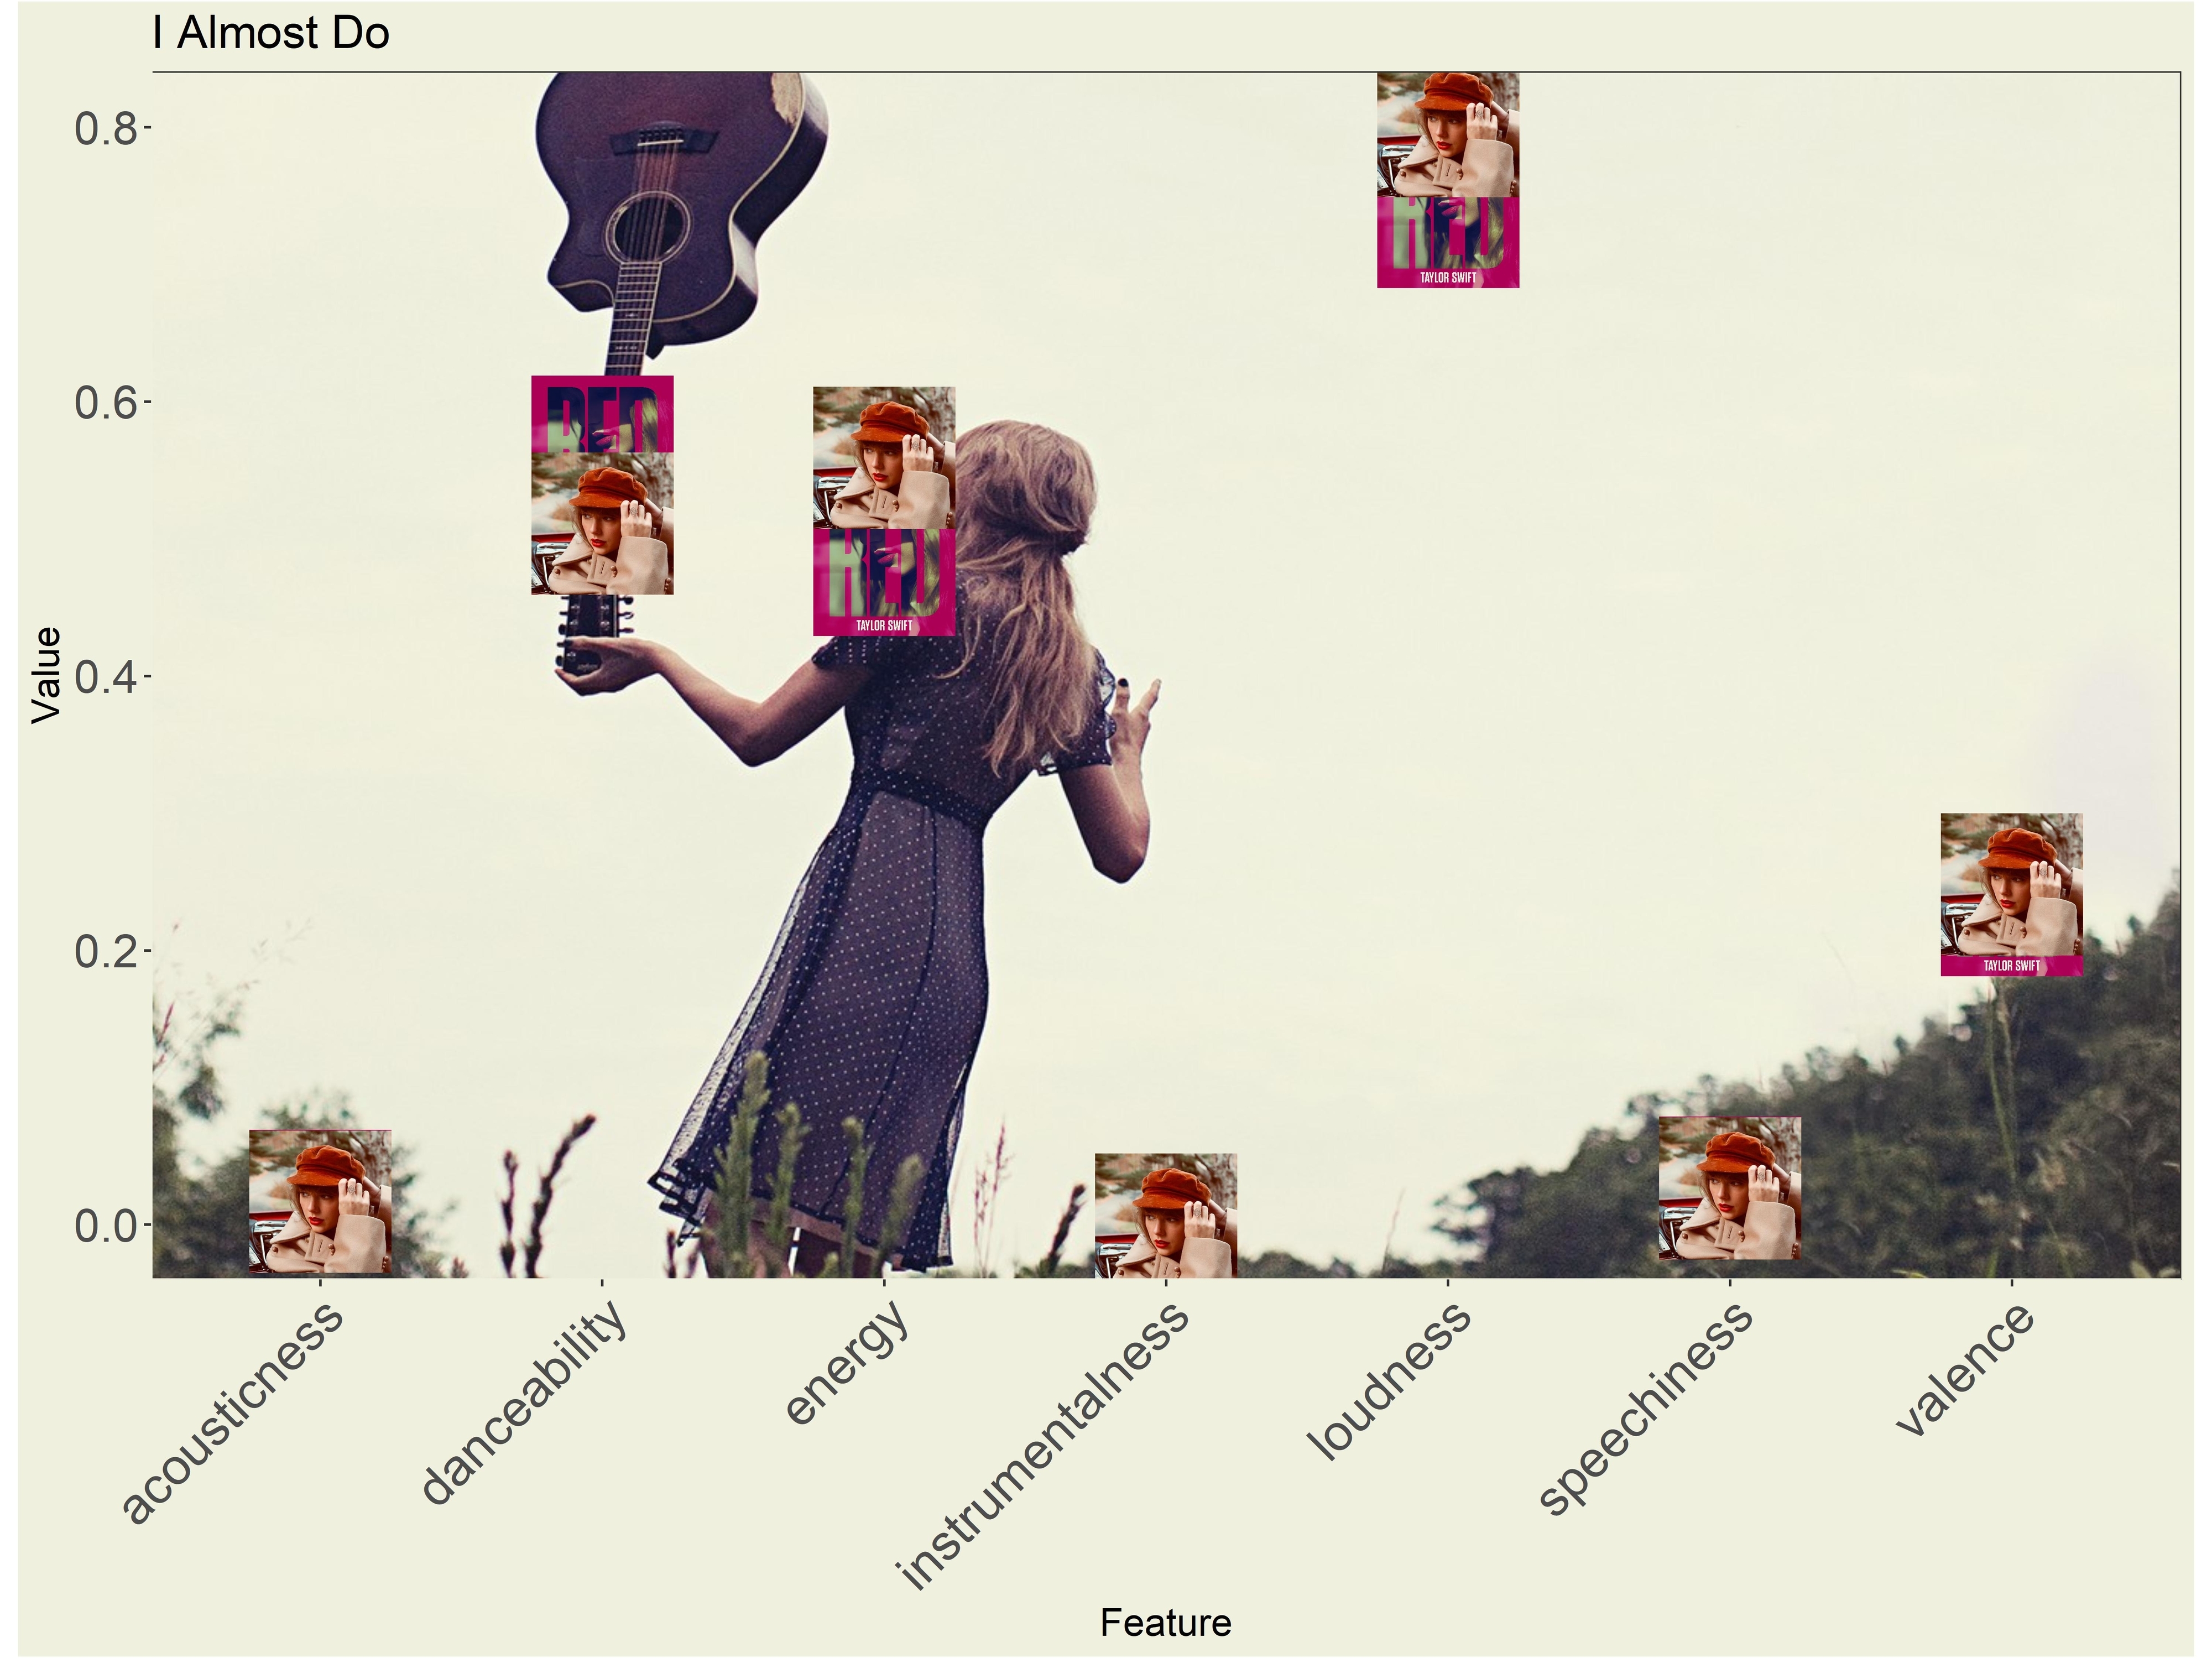
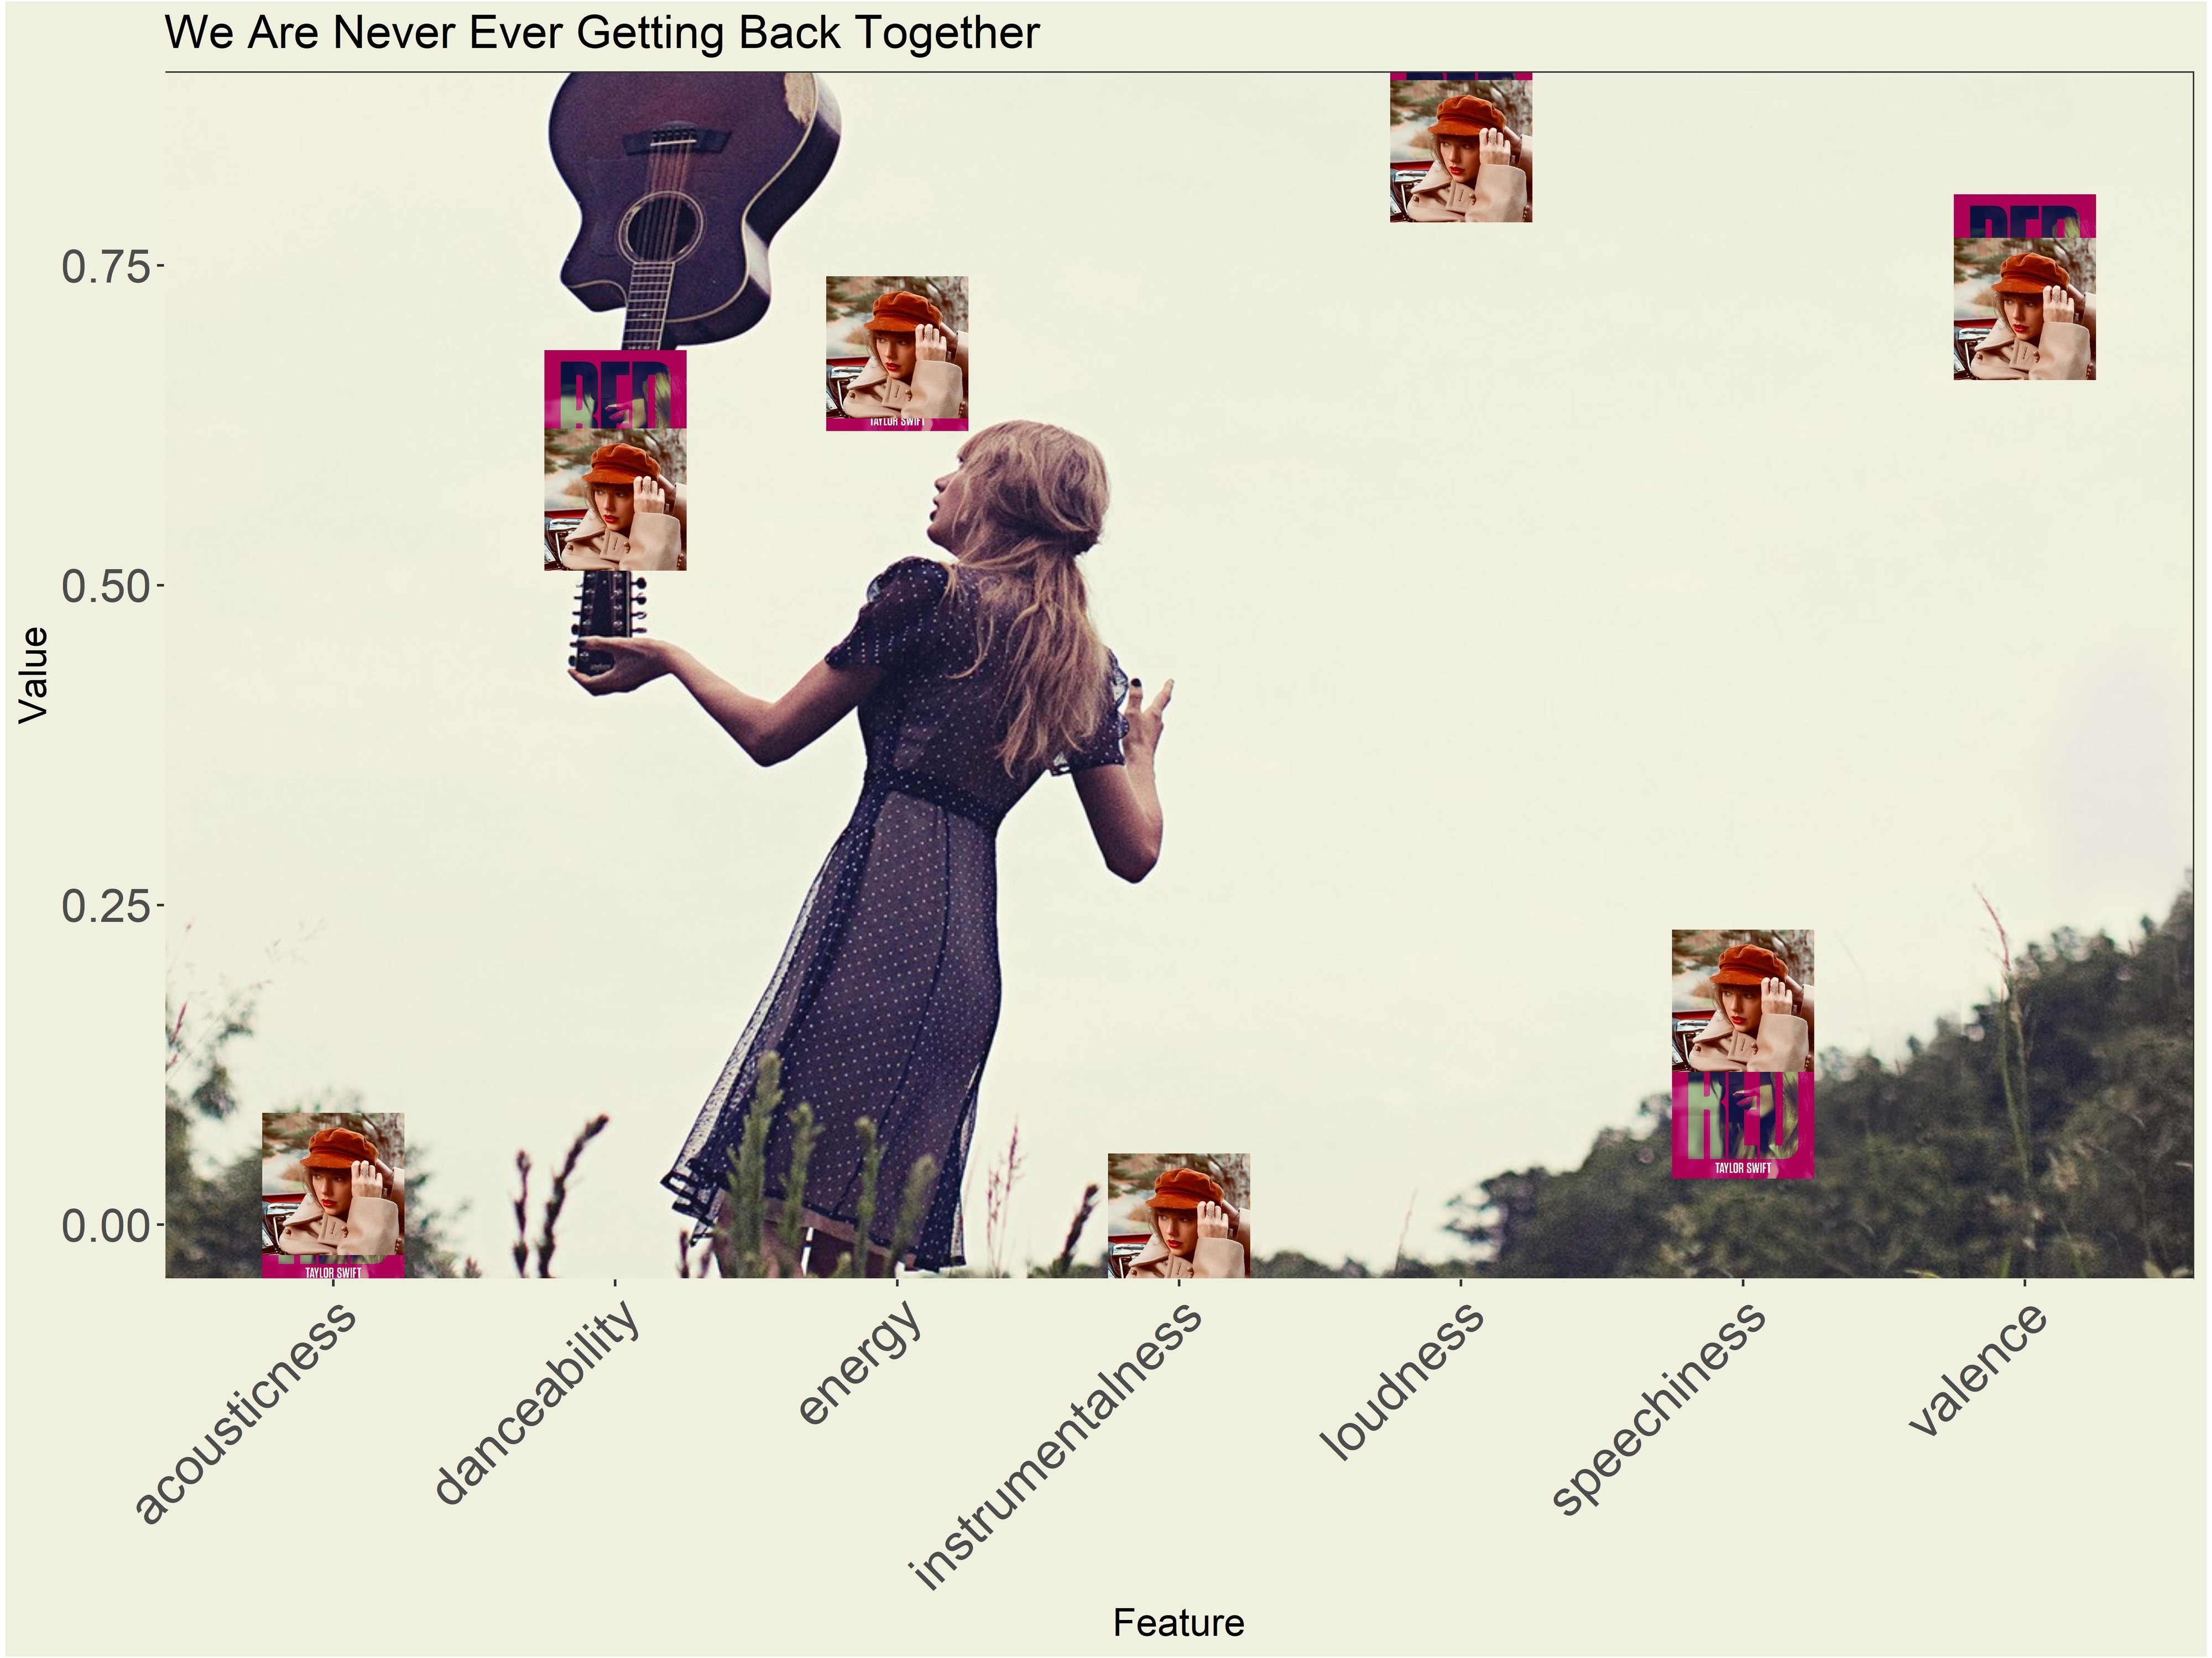
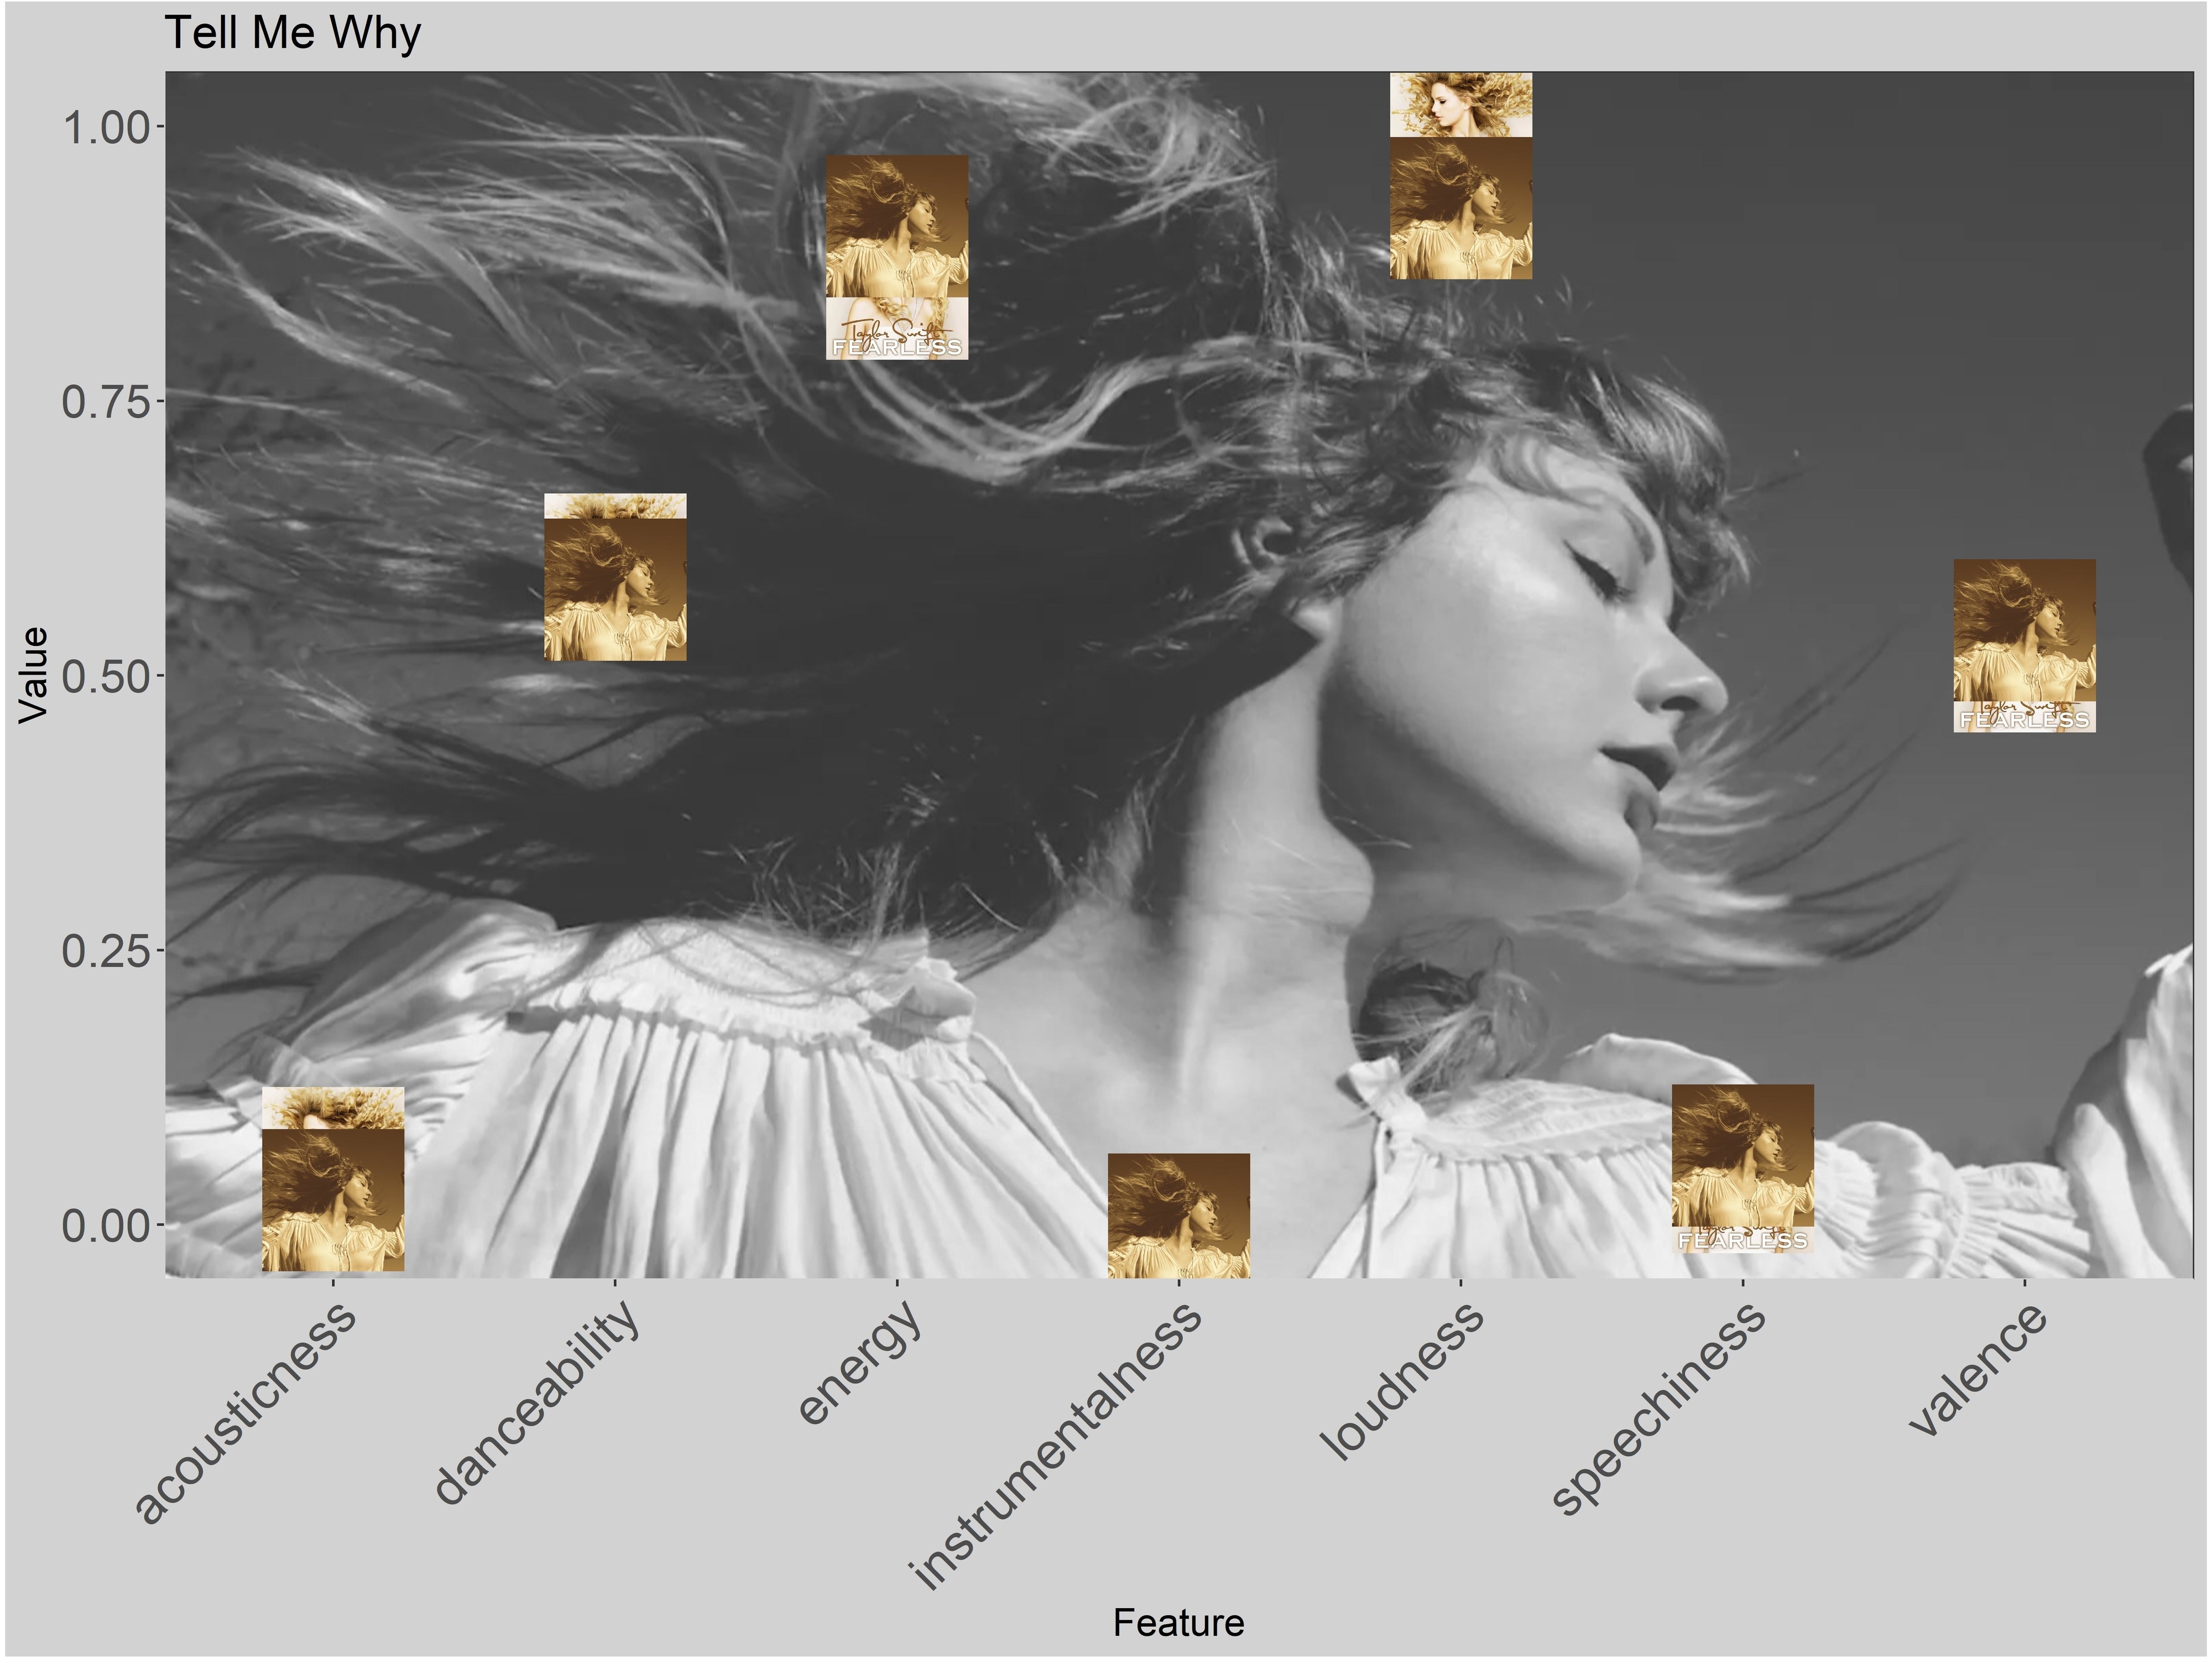
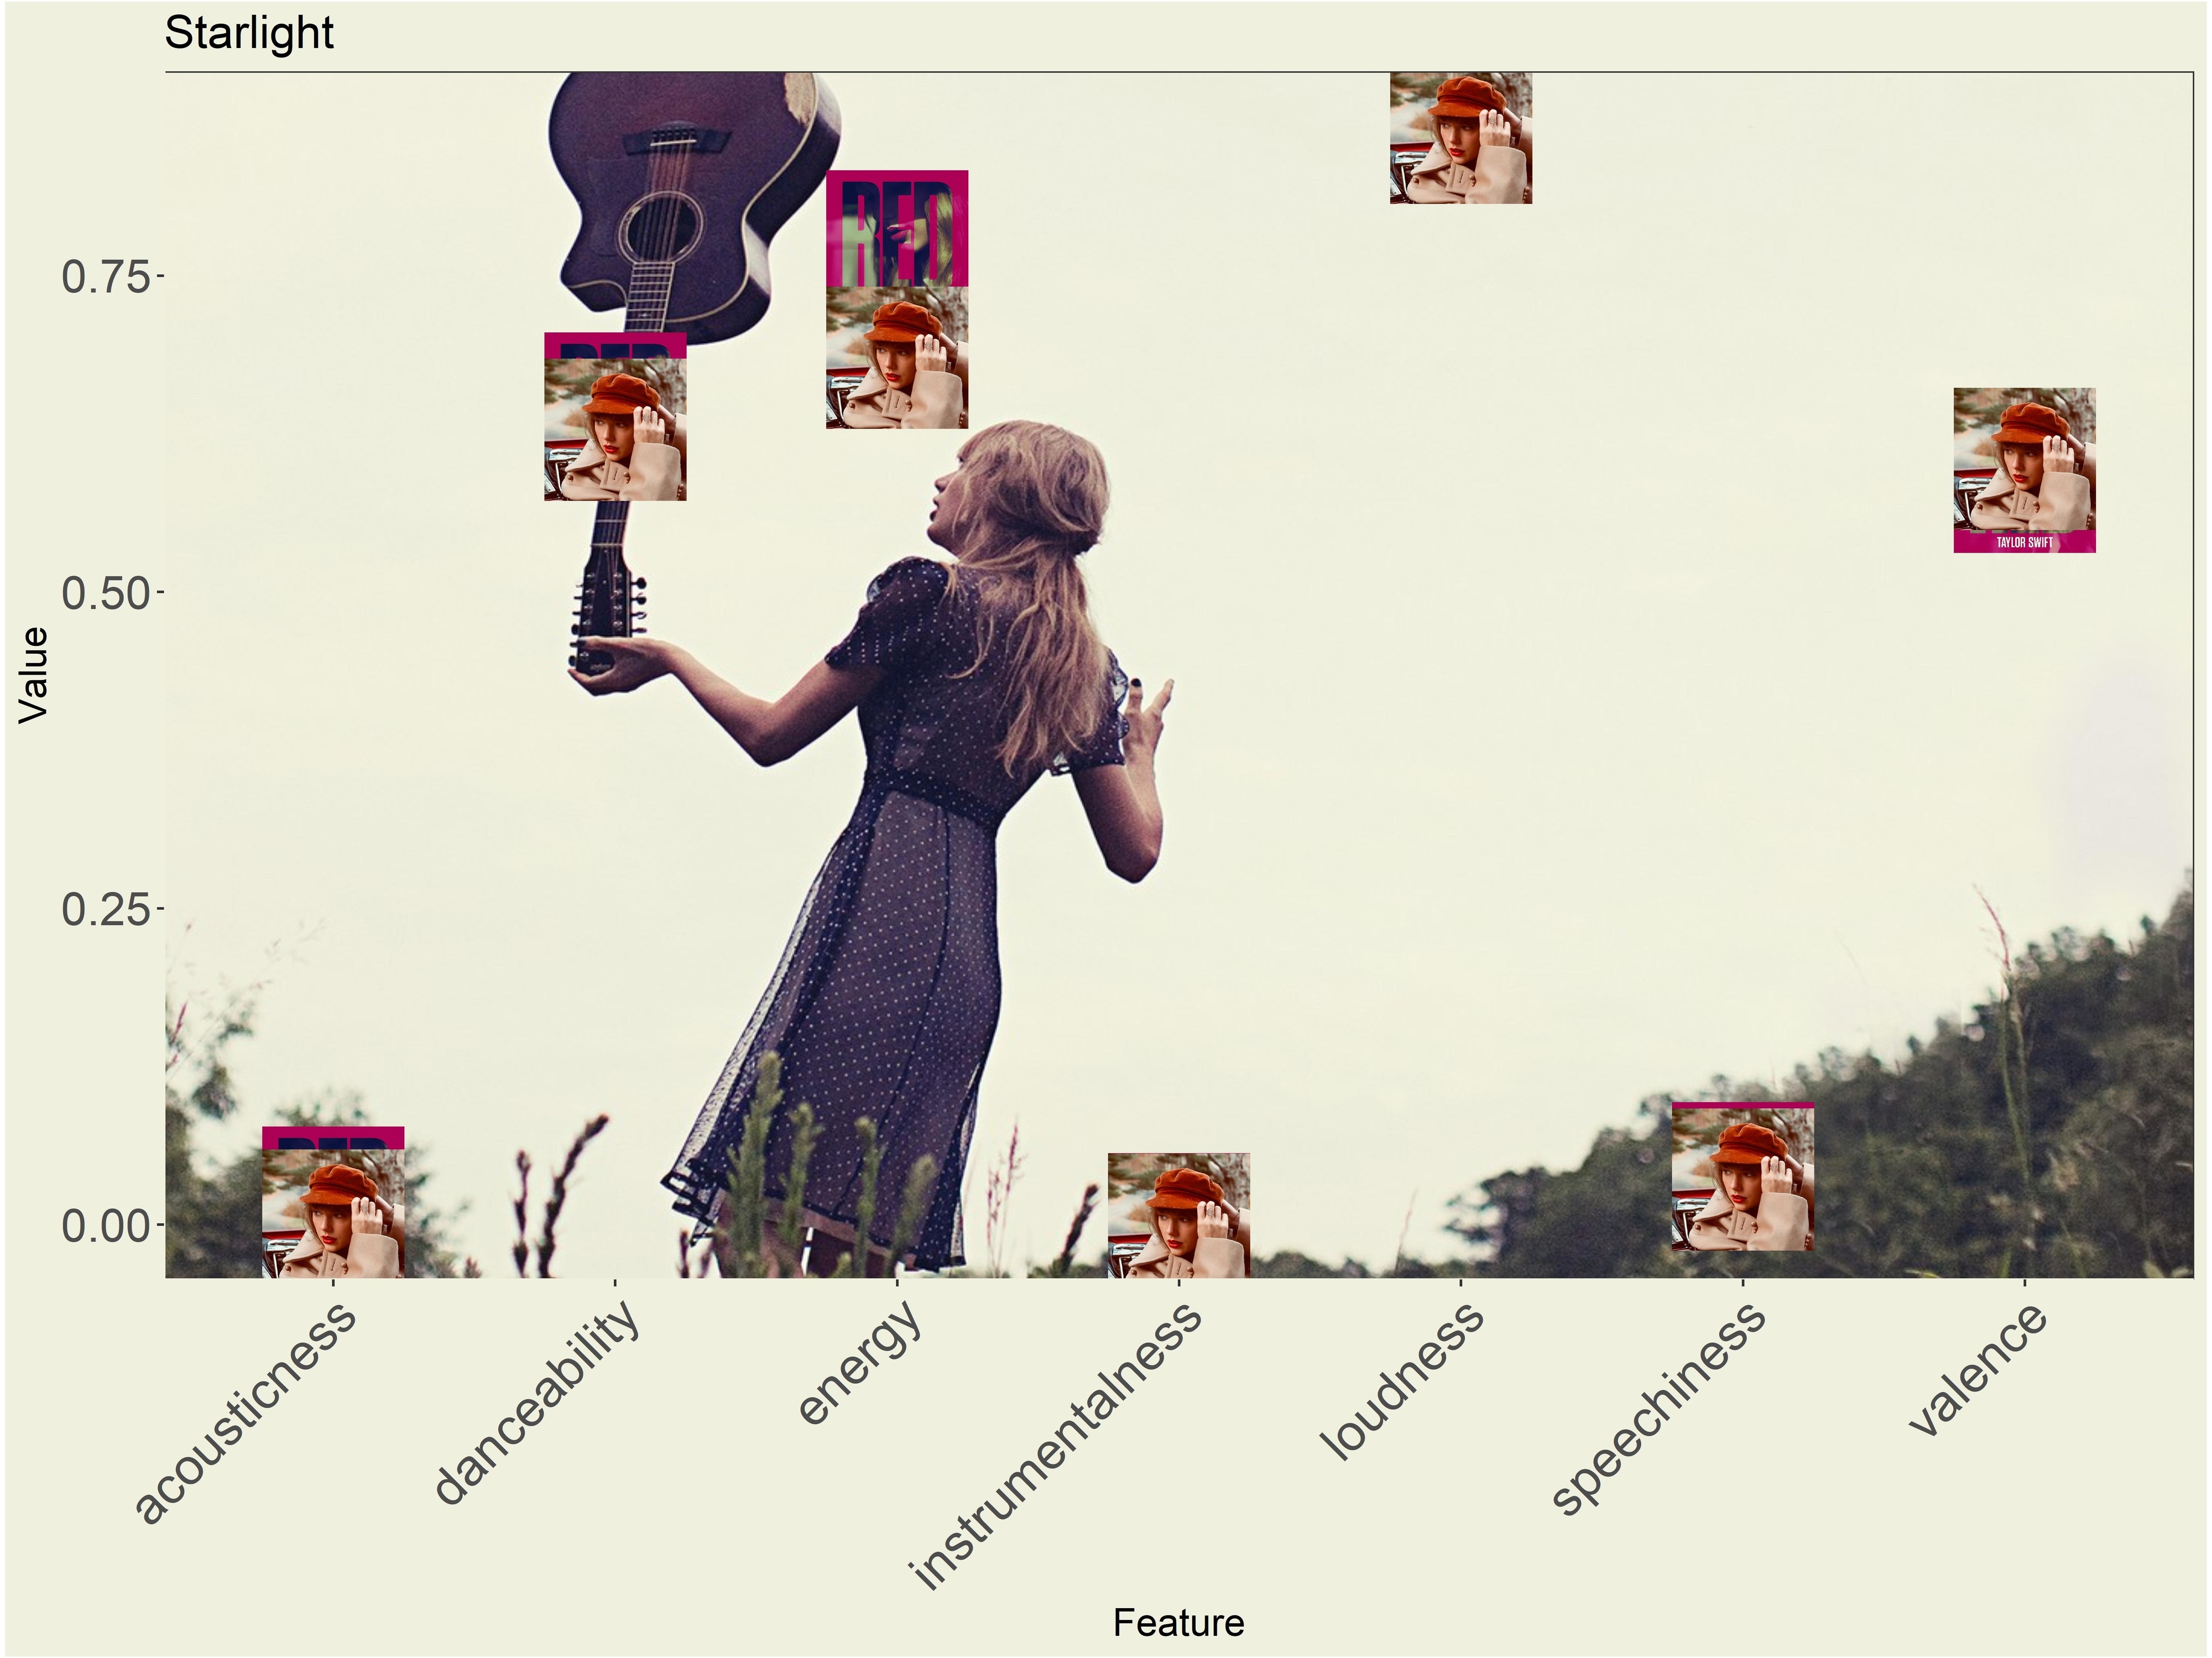
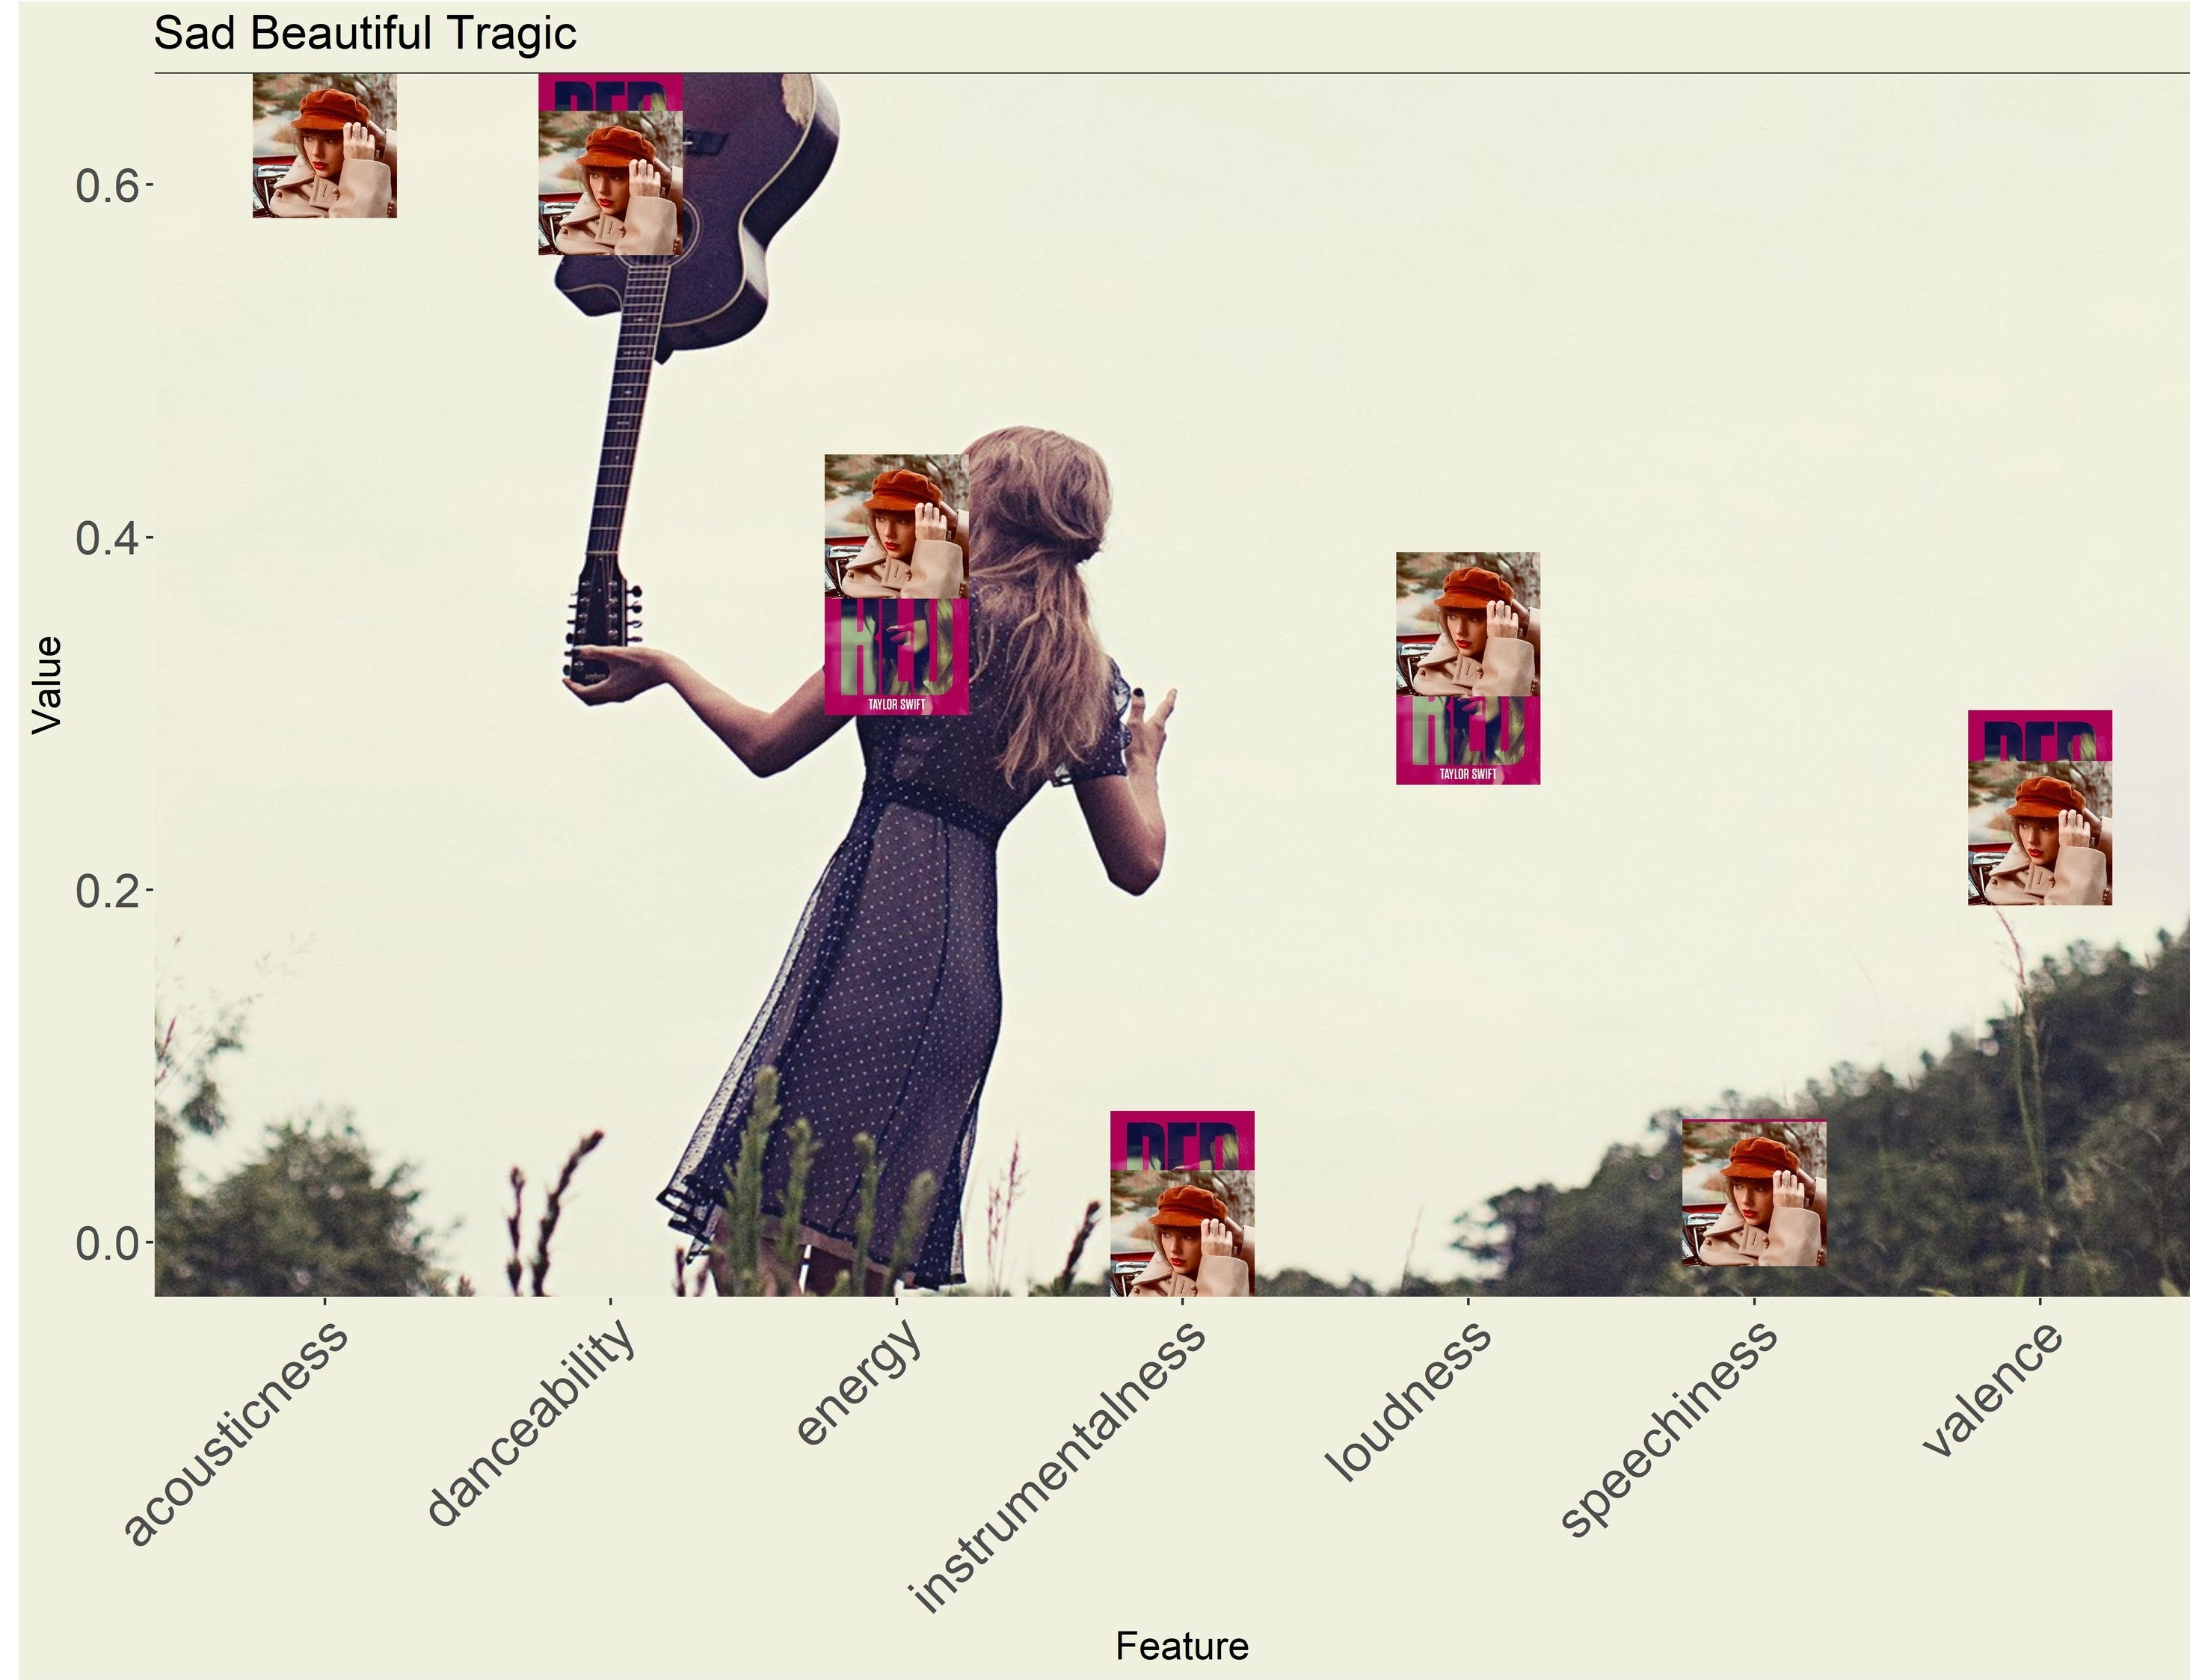
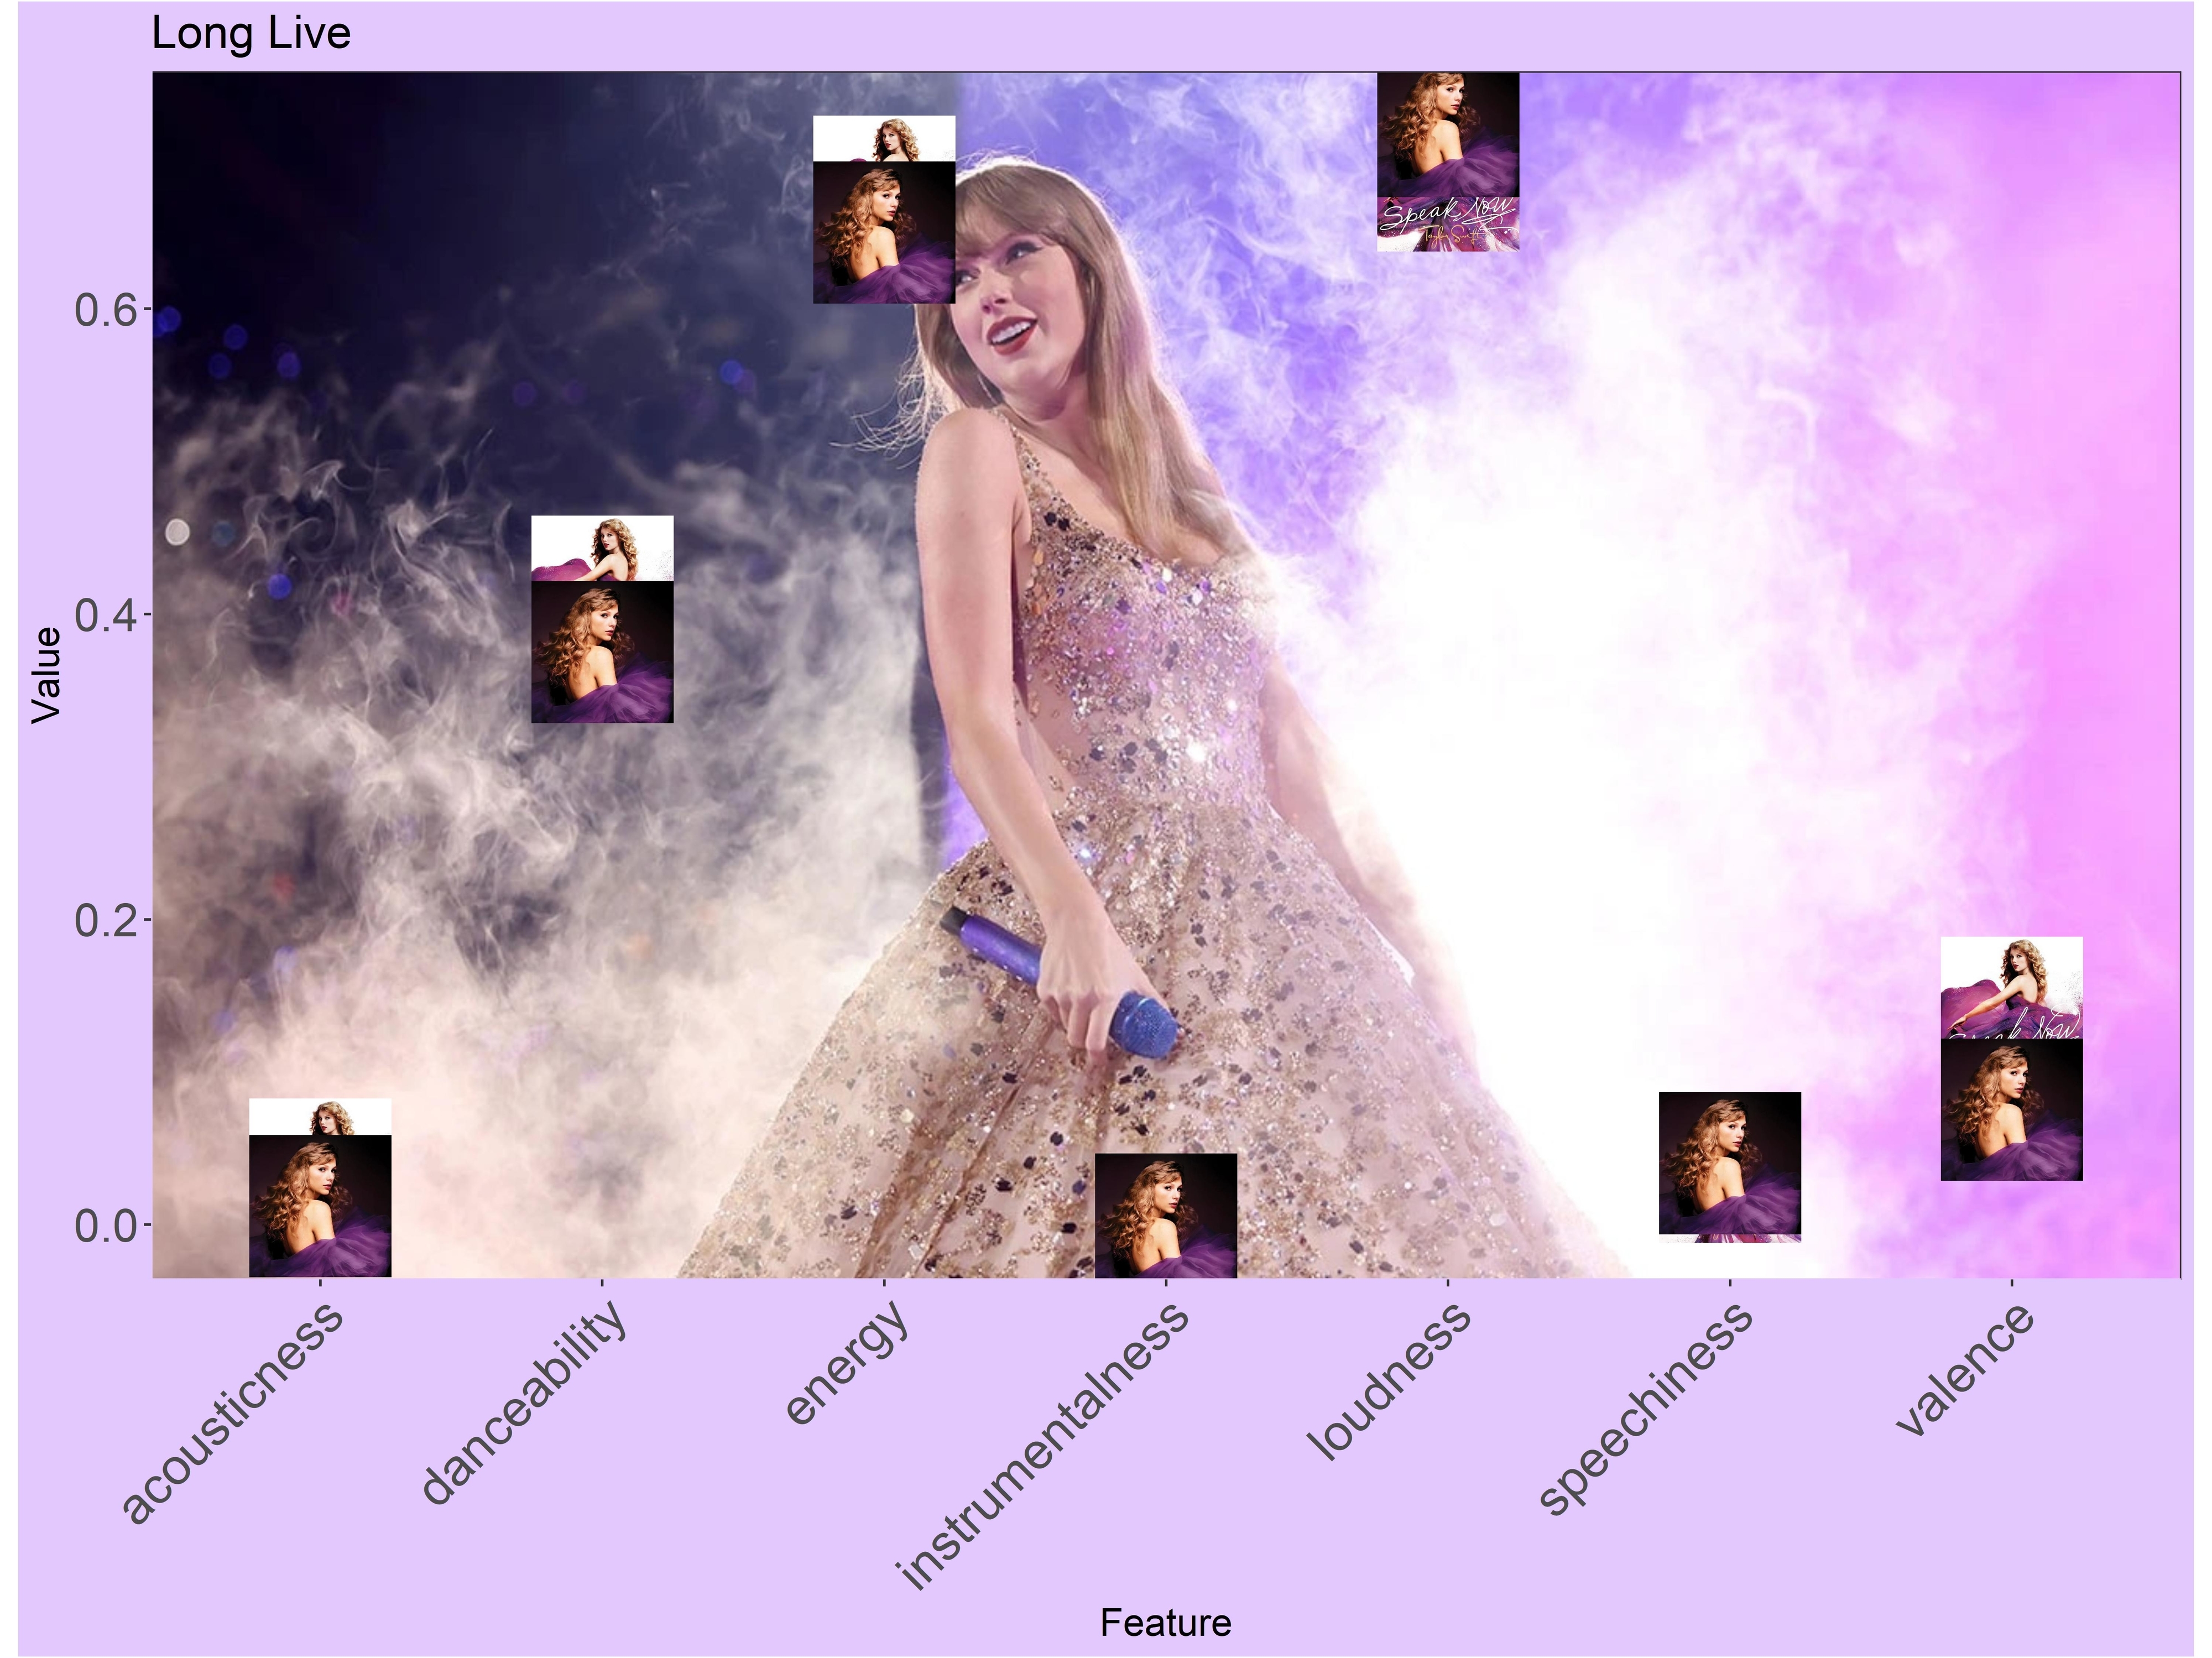
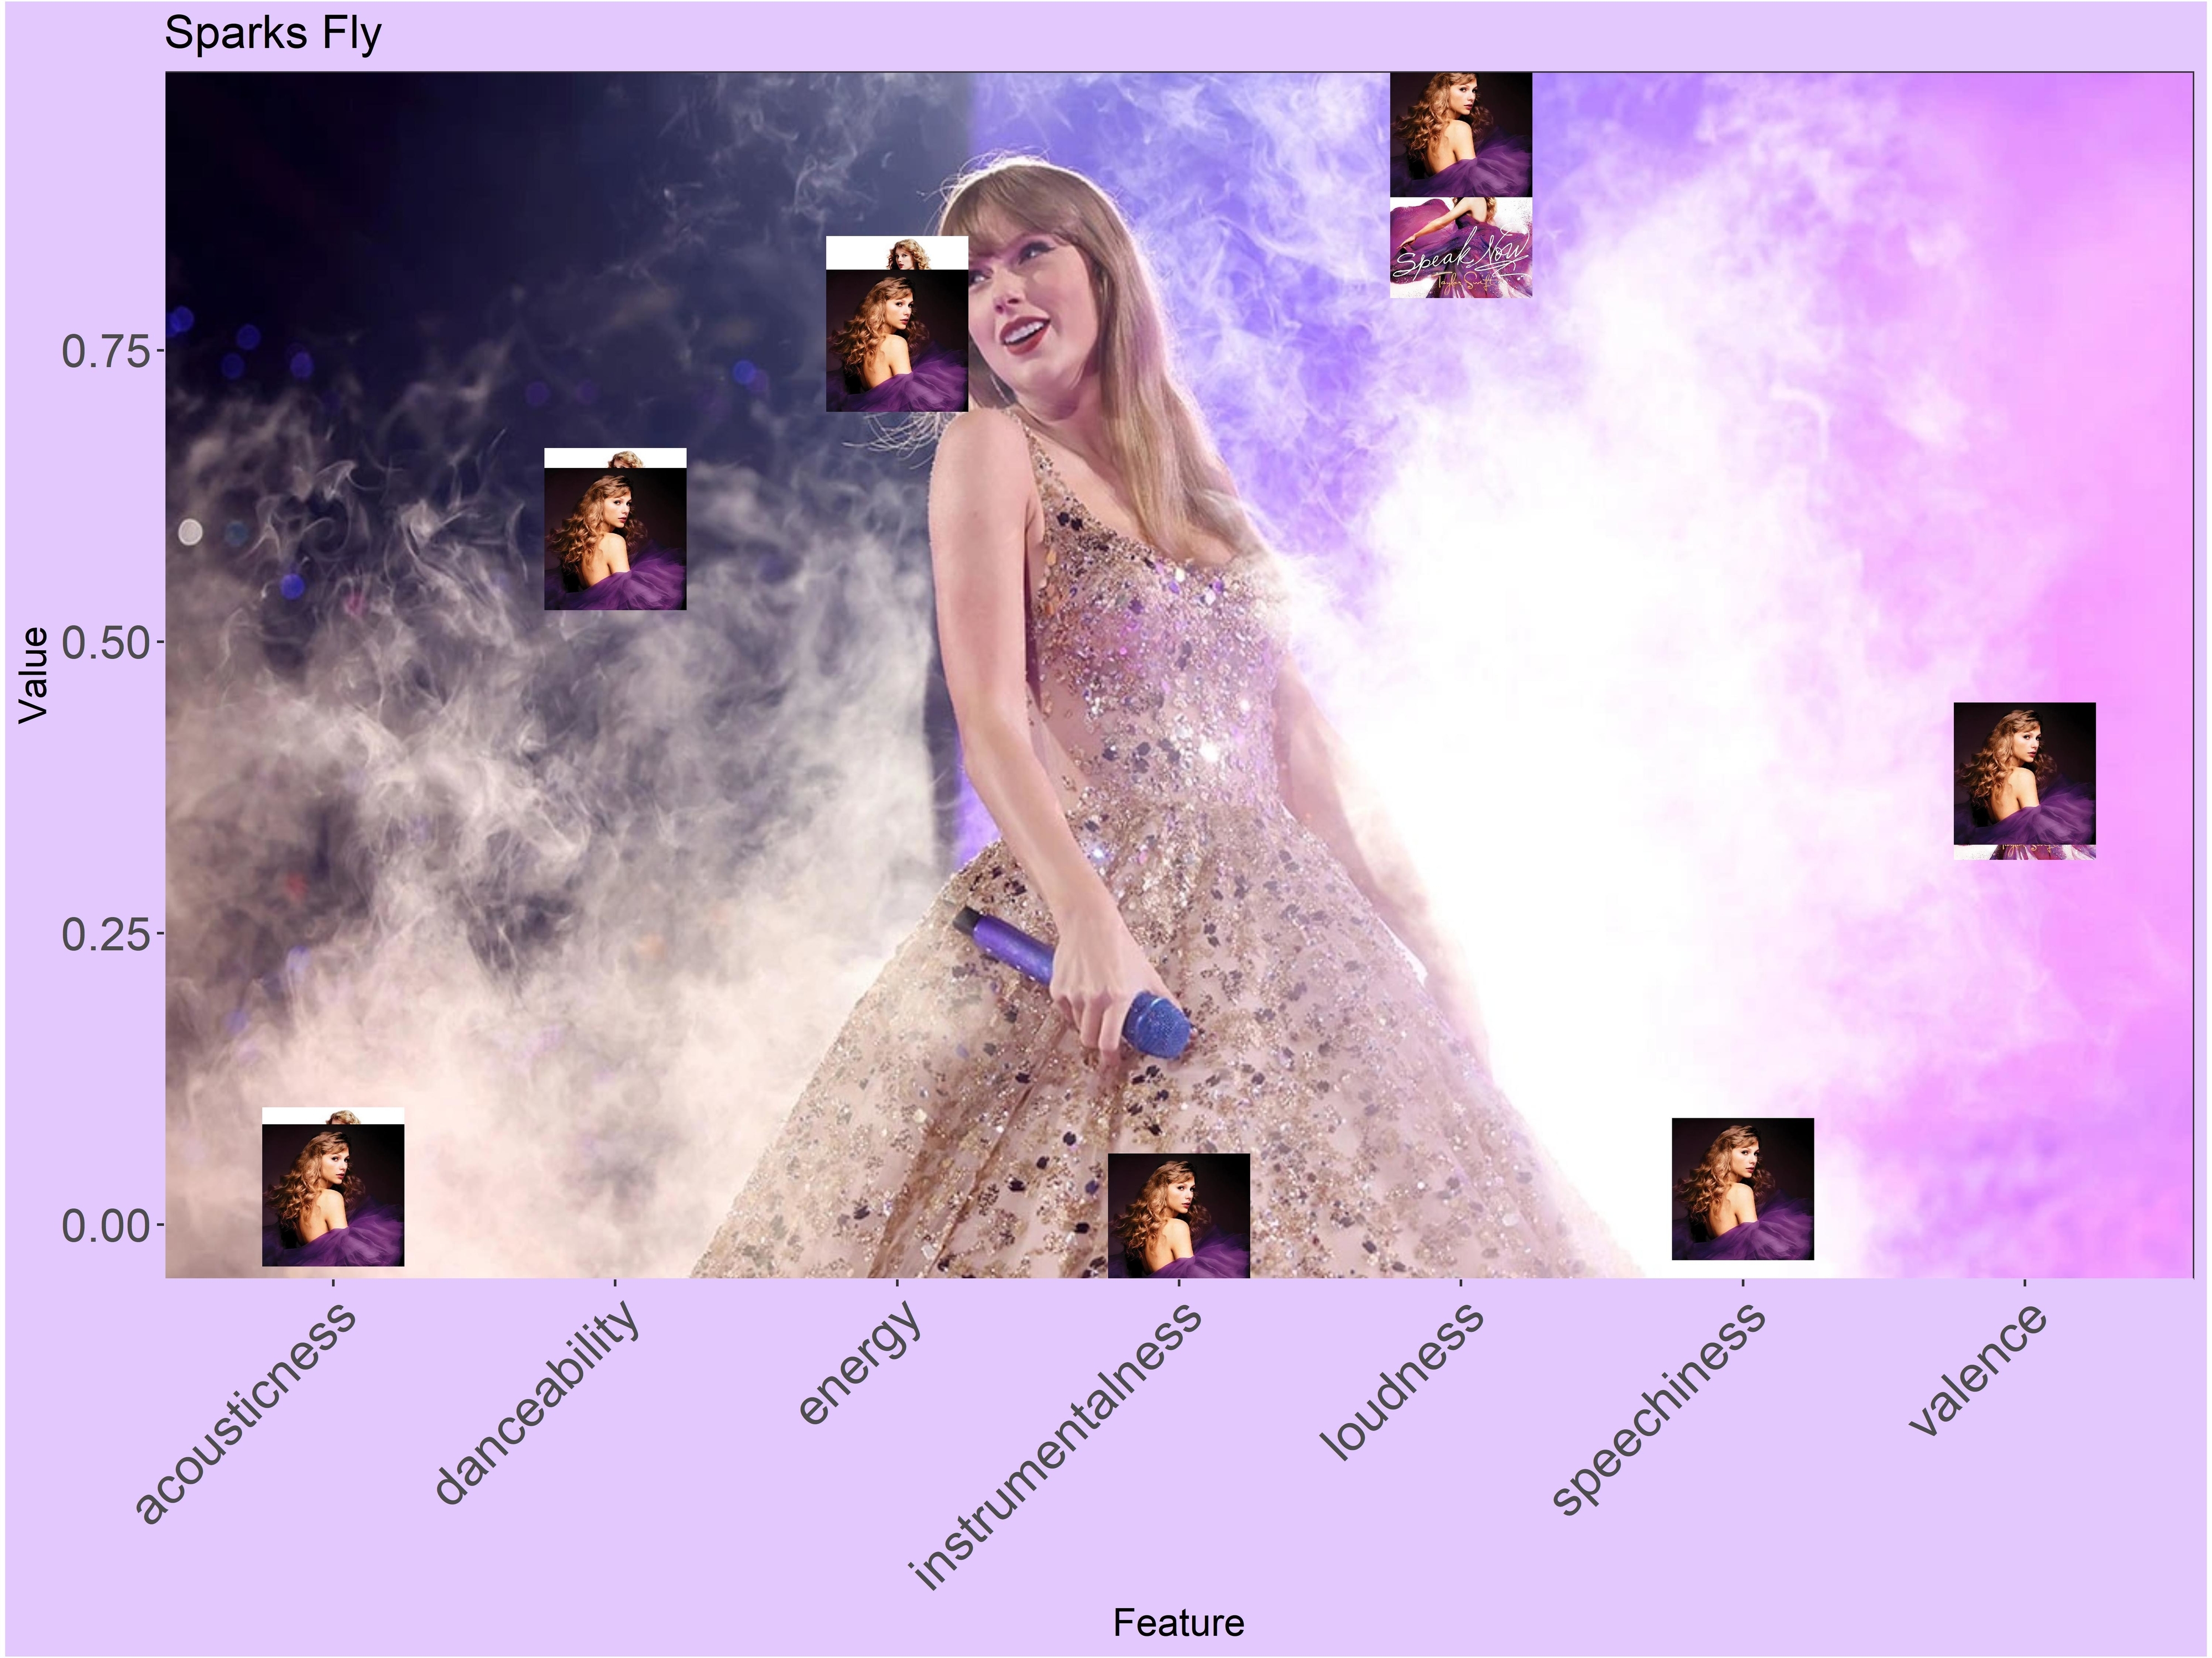
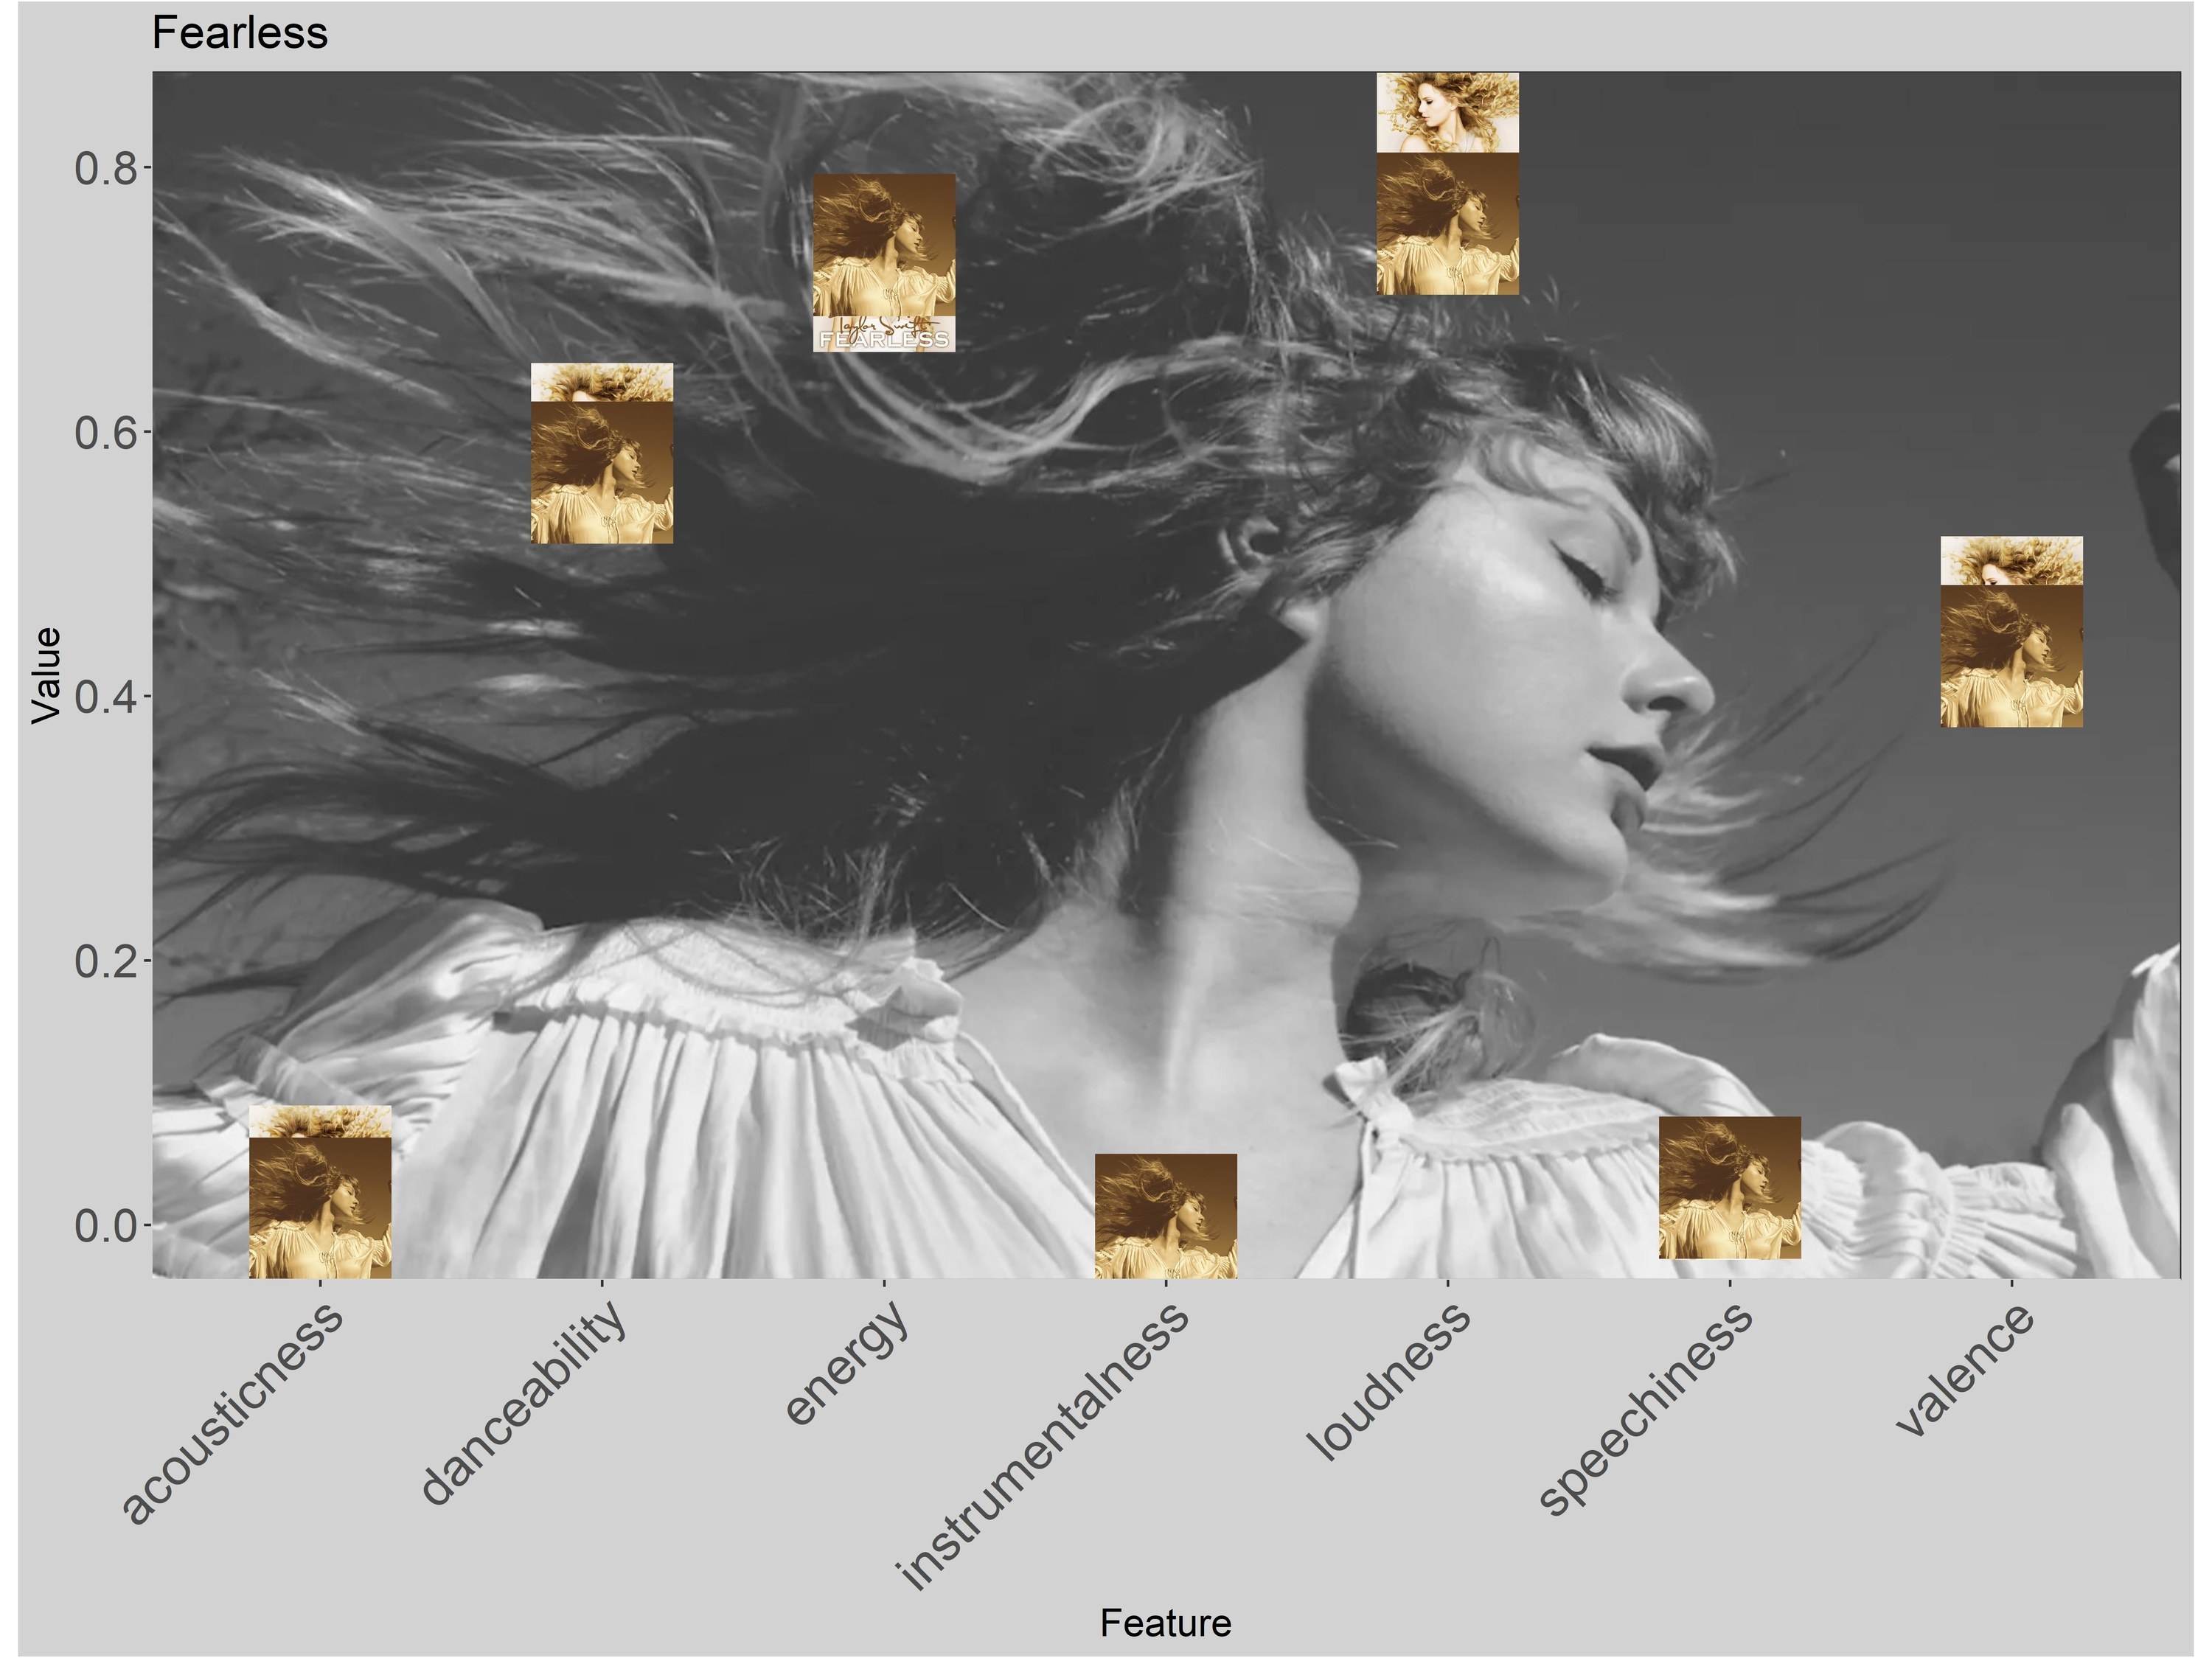
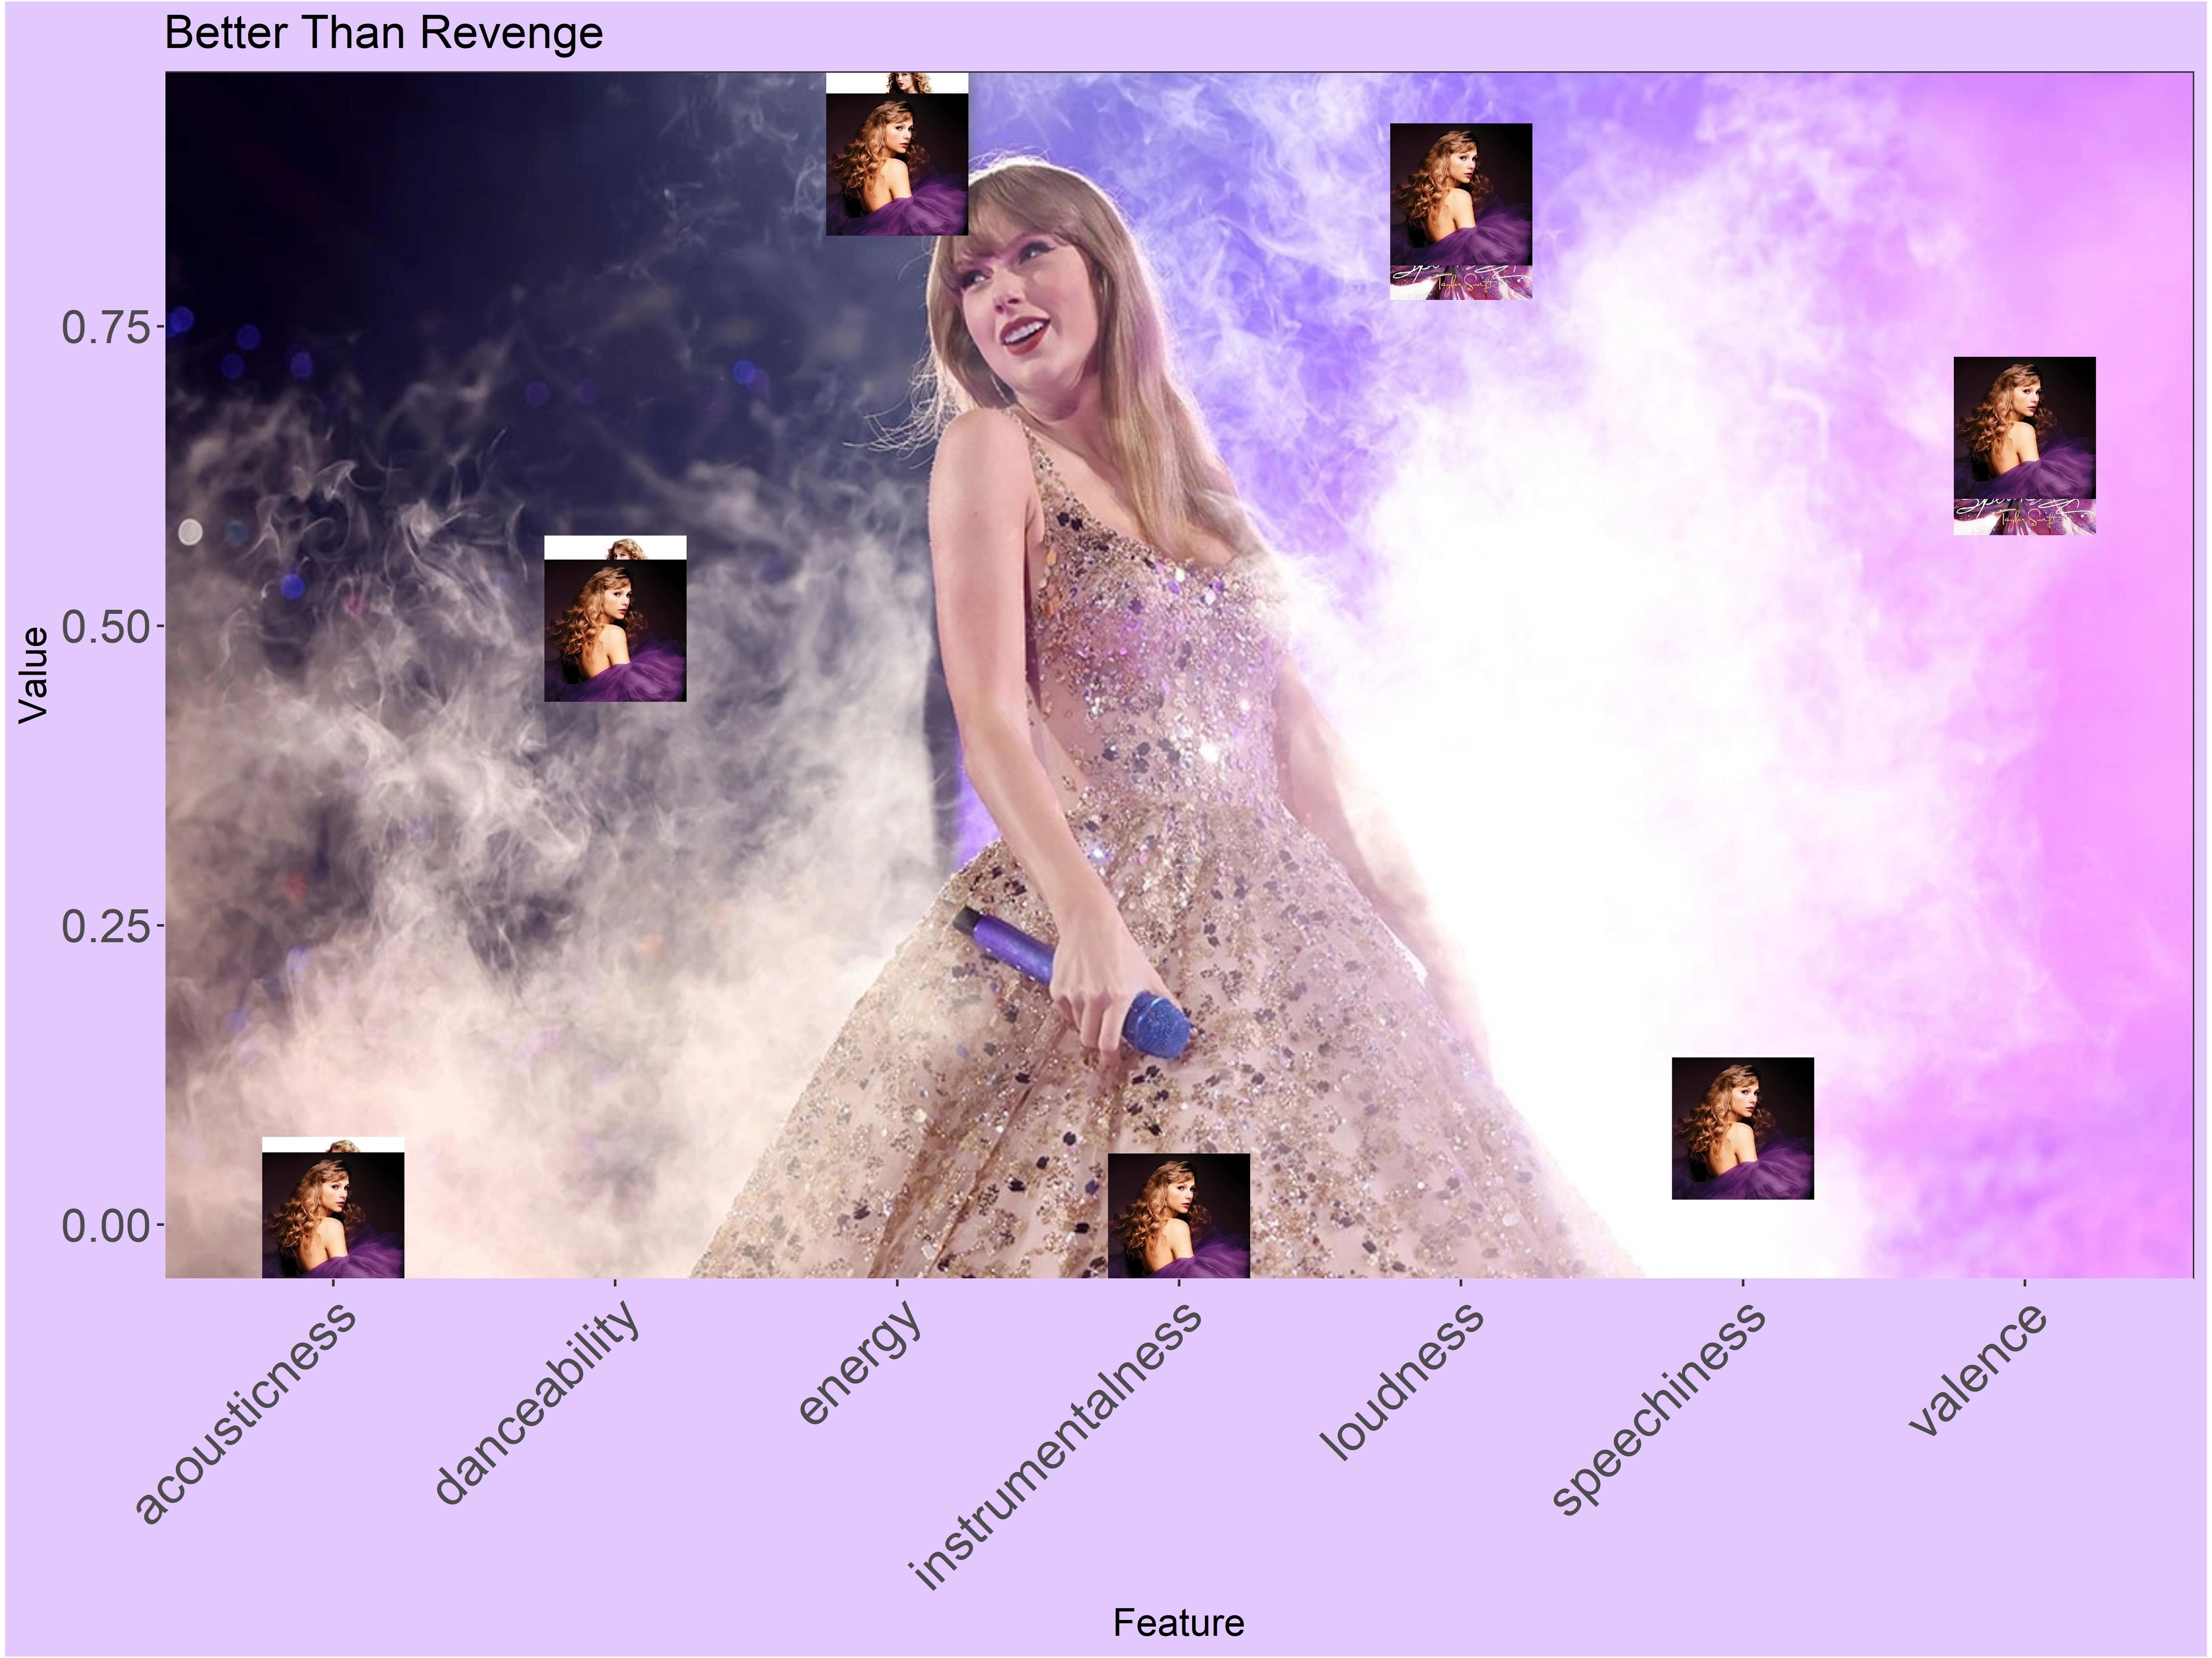
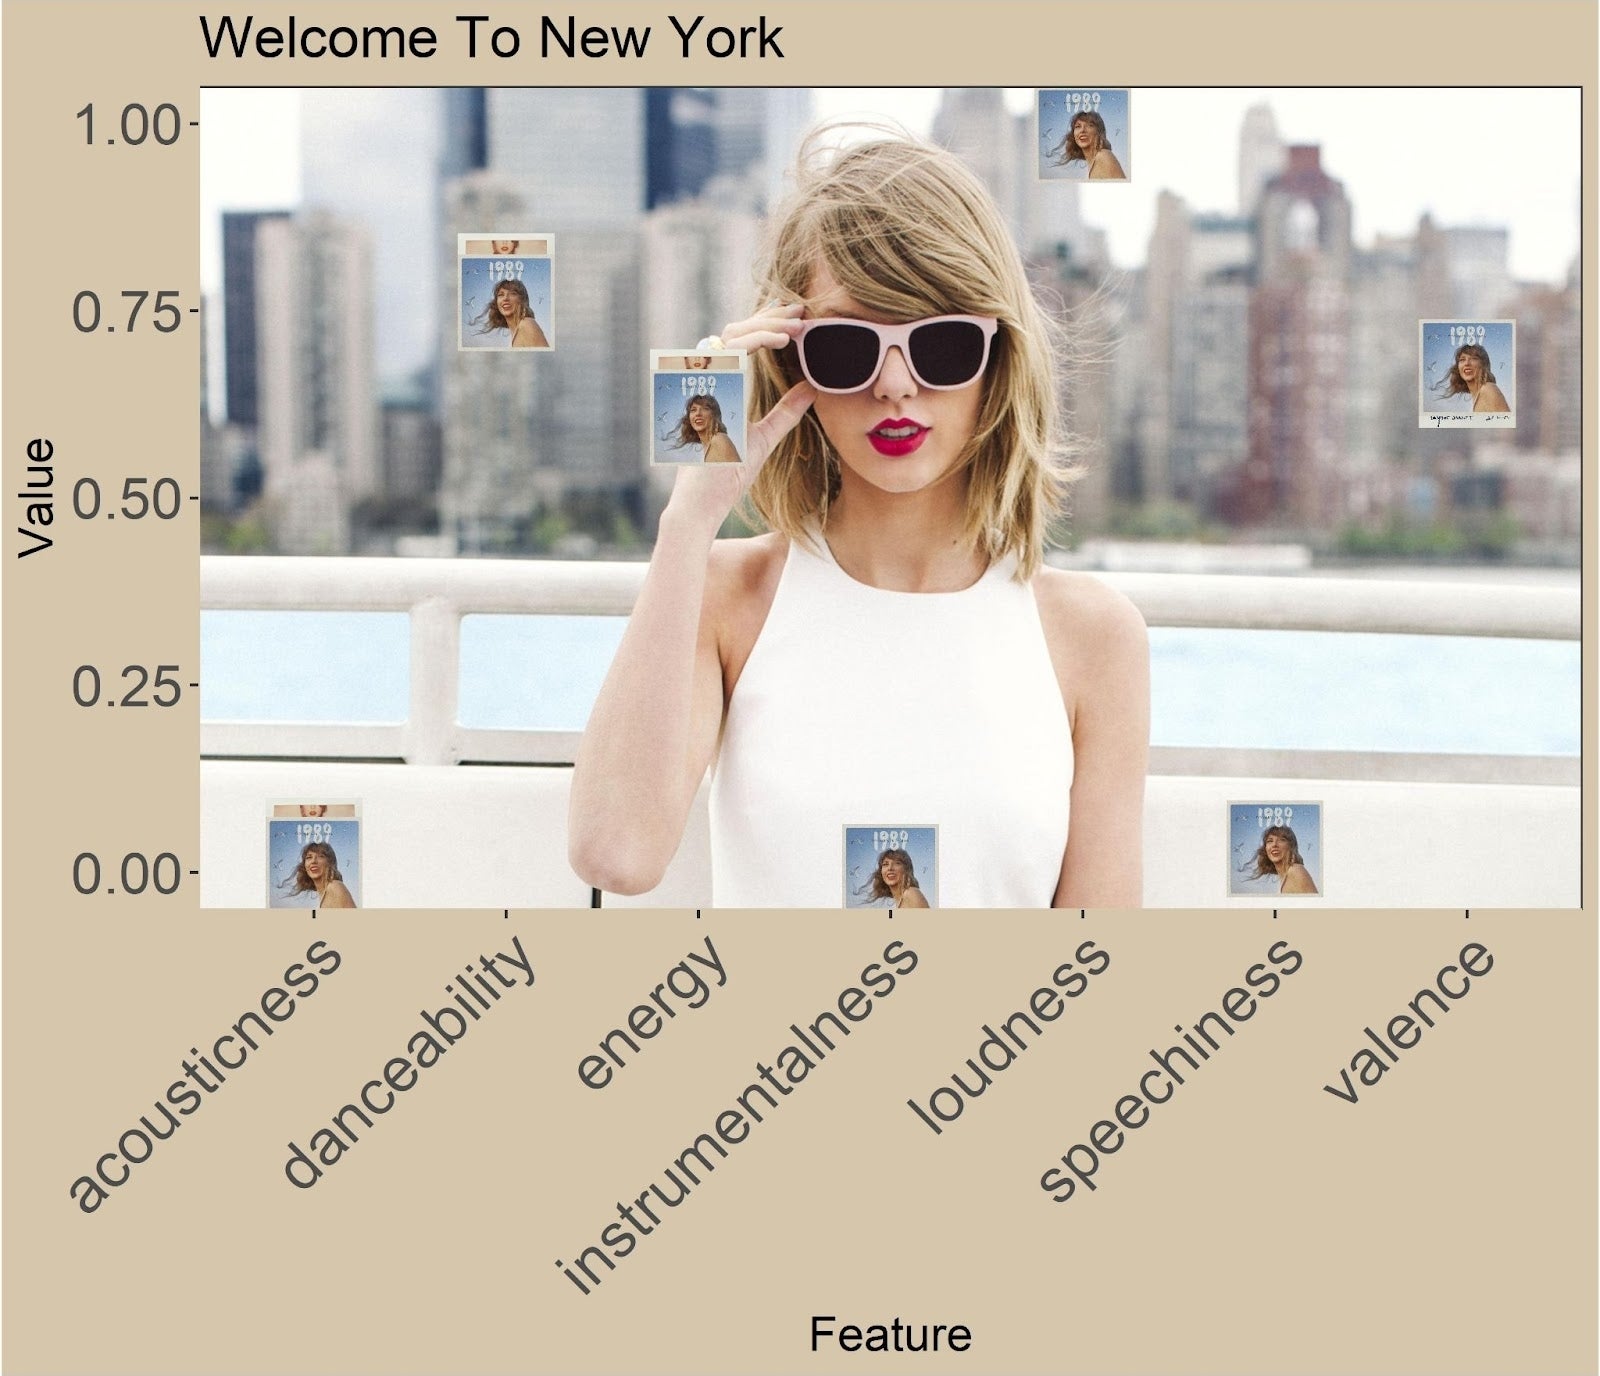
For each song, I generated a graph showing the audio metrics for Taylor's Version and its first version. If a variable on the graph only shows one album cover, it is because the values are so similar that the points overlapped.
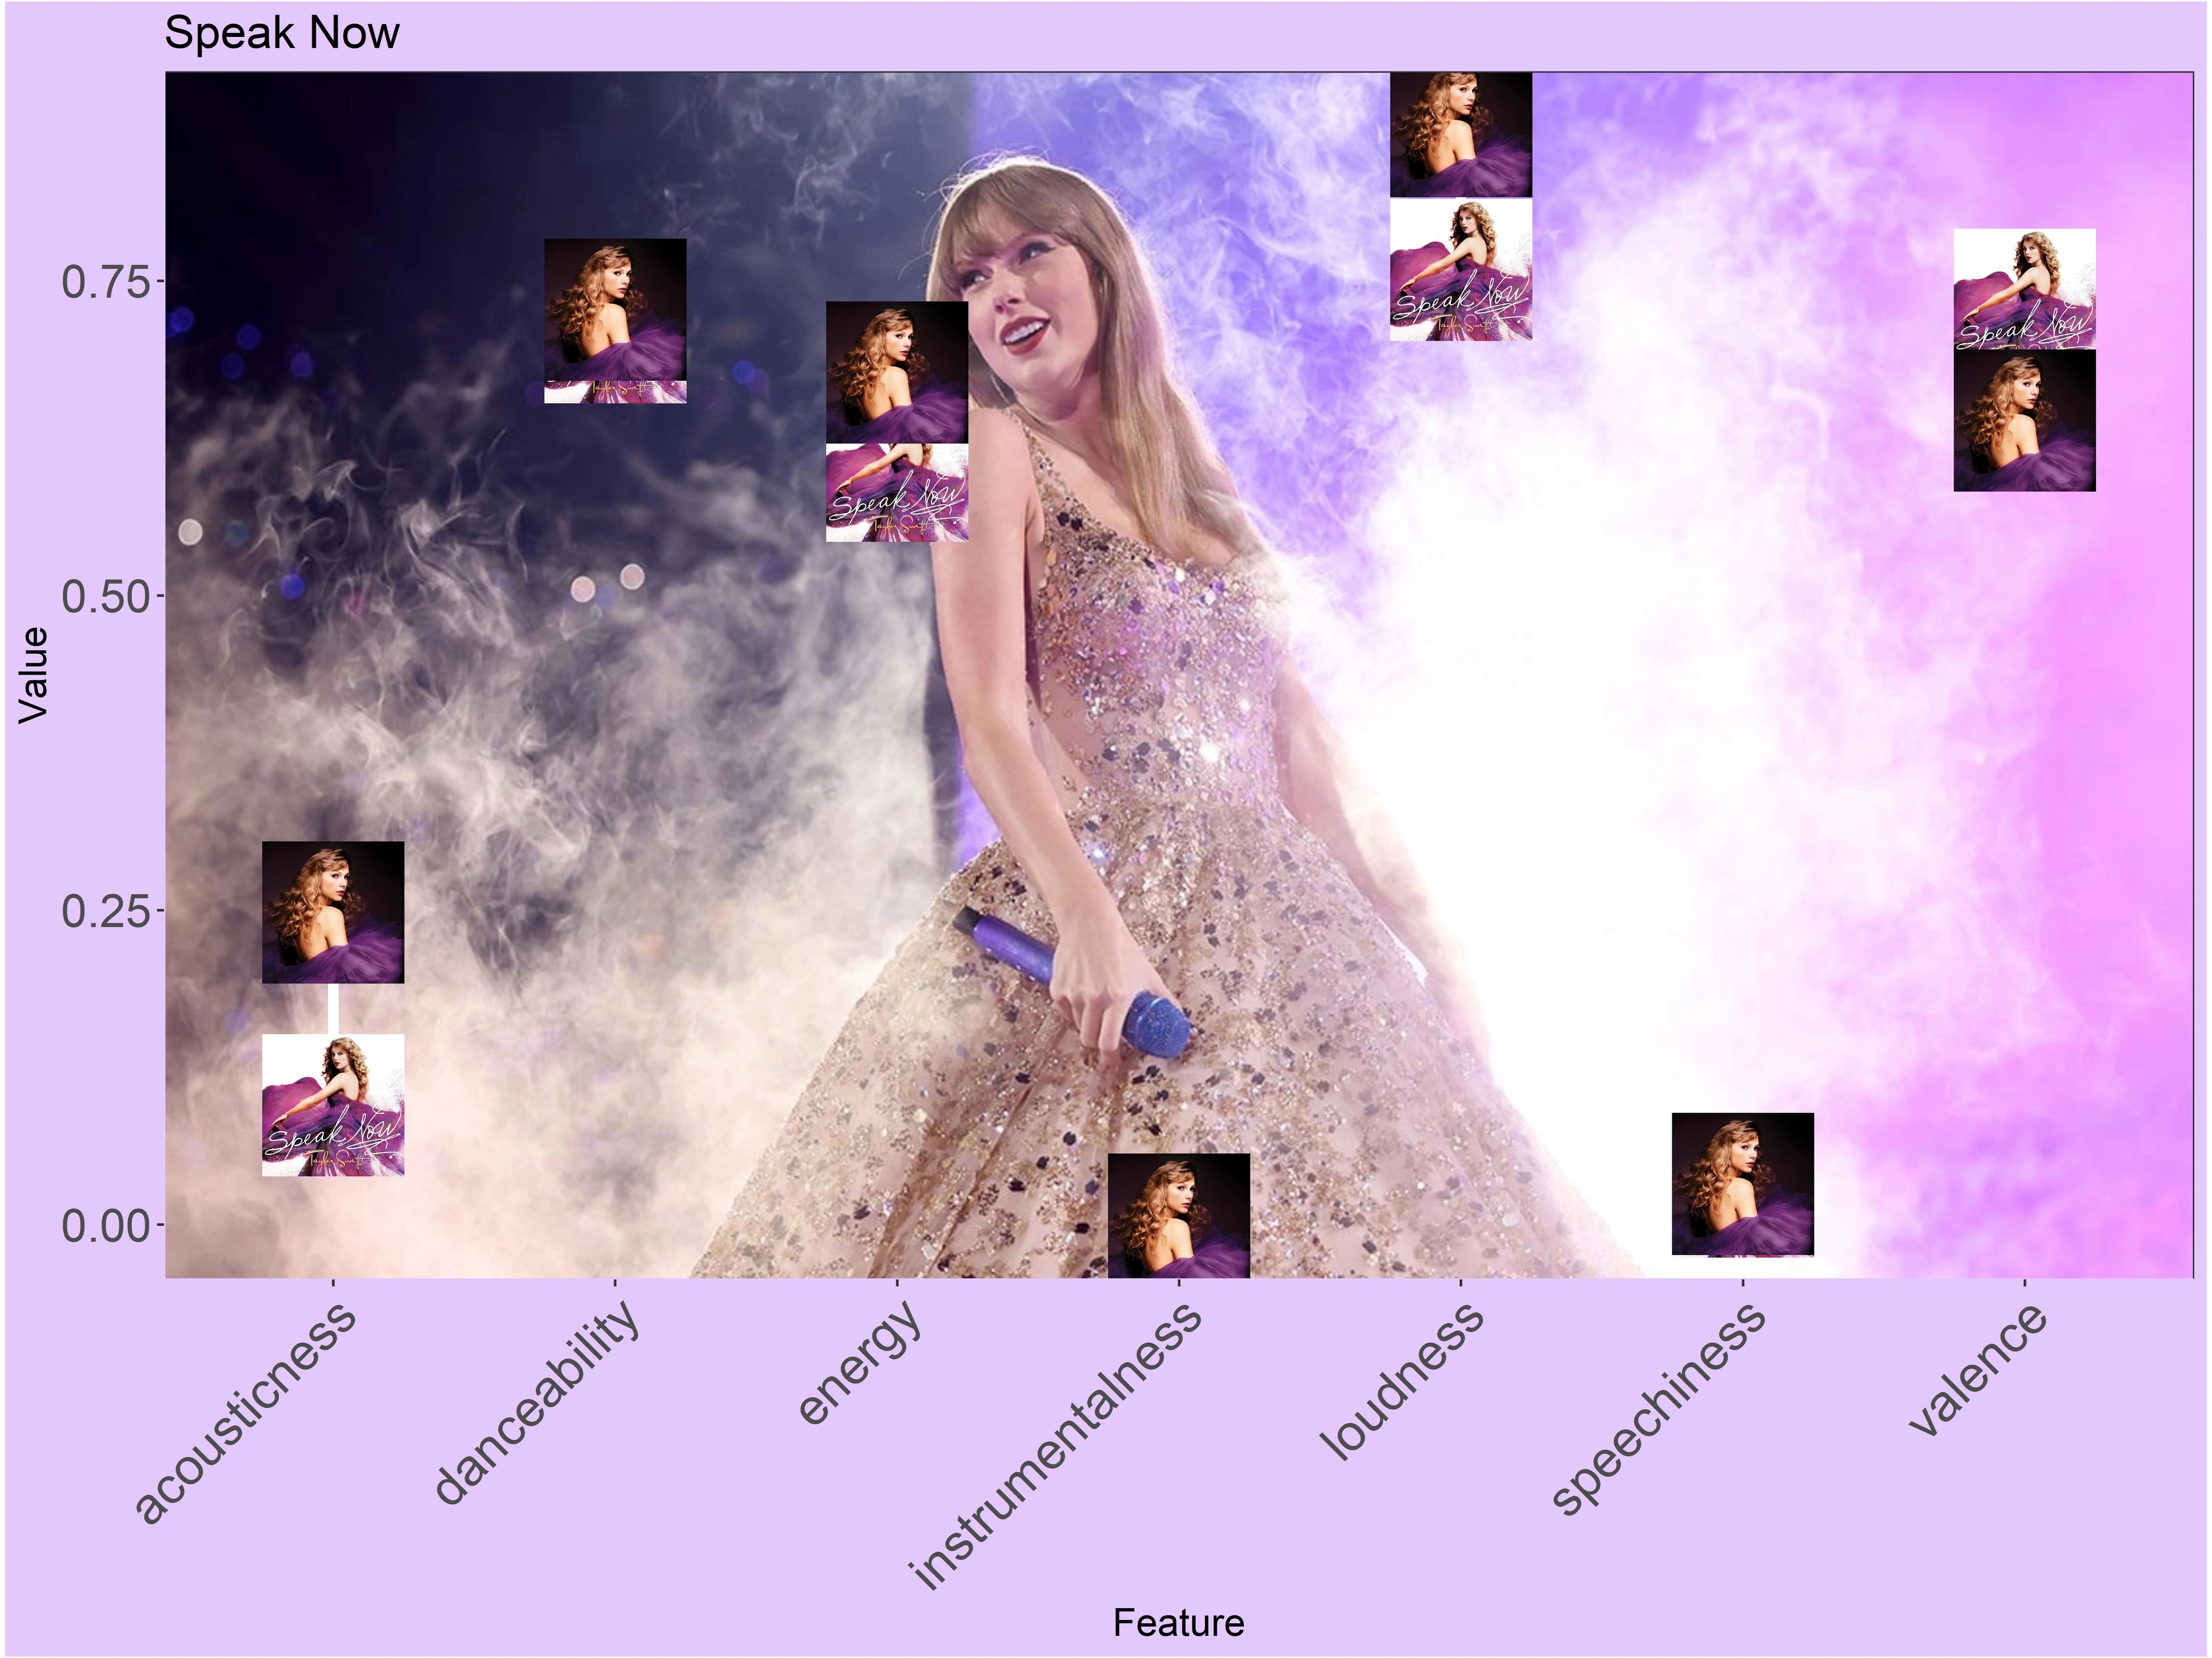
20 — "Speak Now"
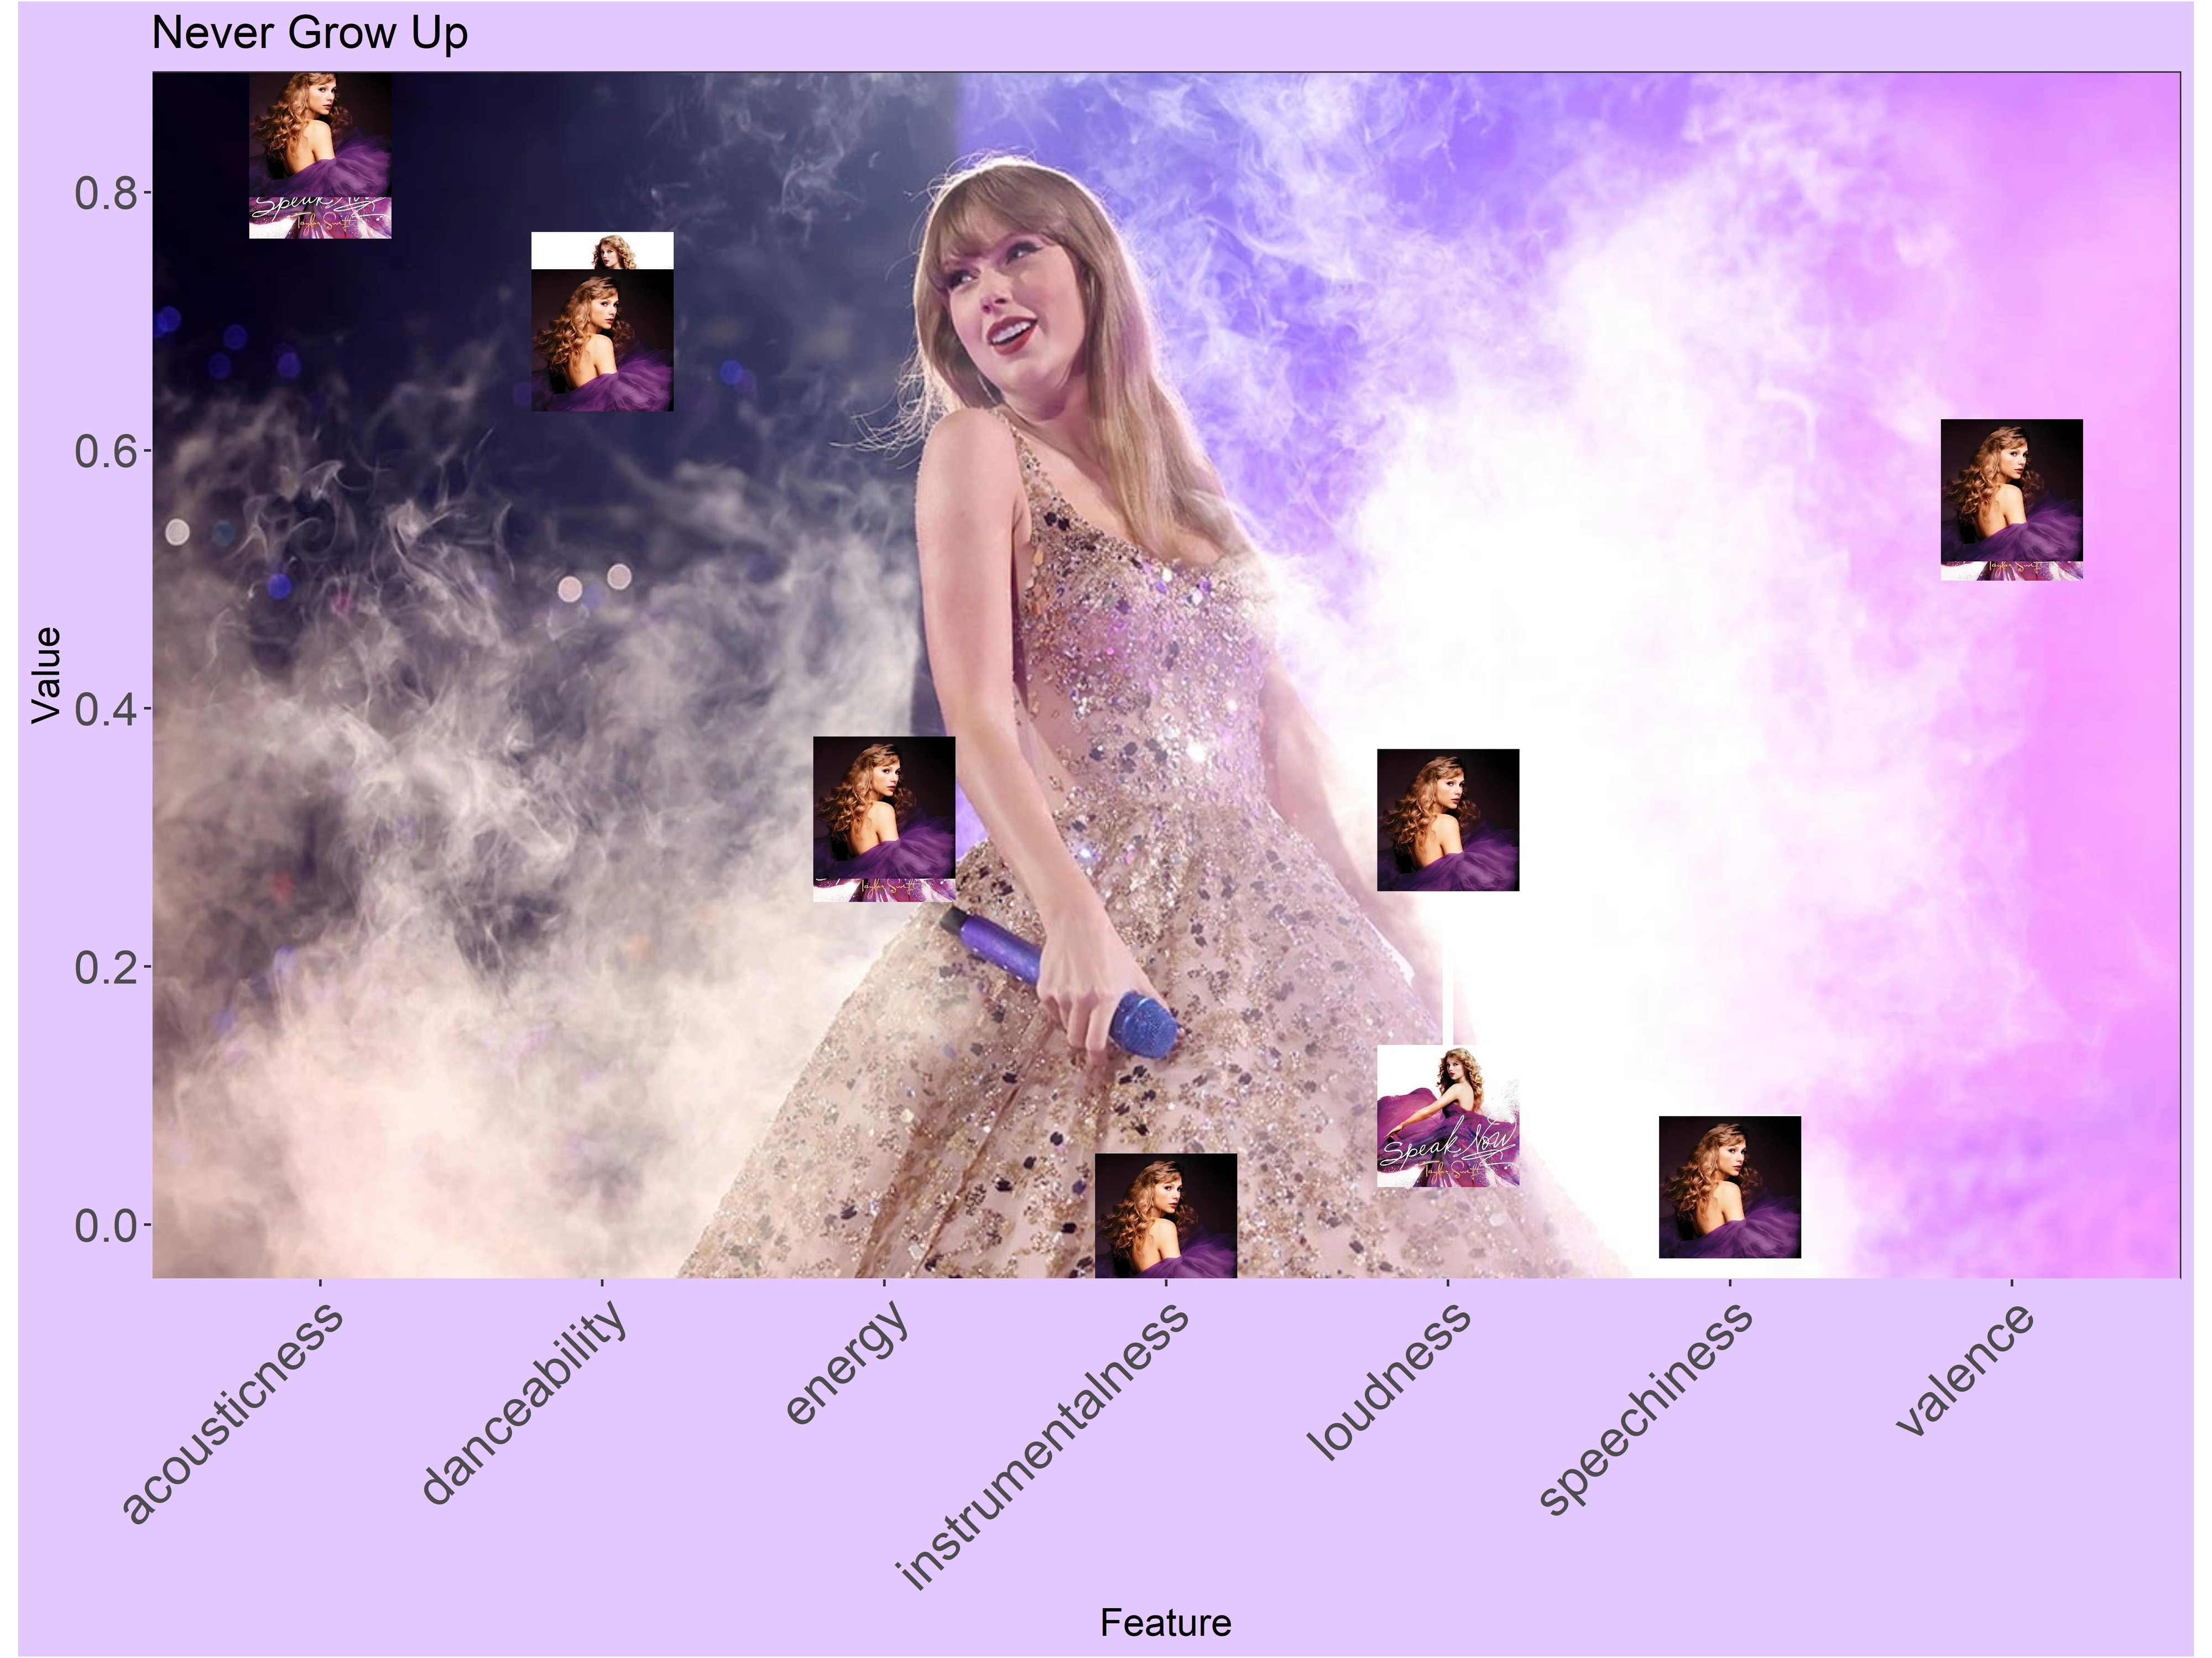
19 — "Never Grow Up"
18 — "Mean"

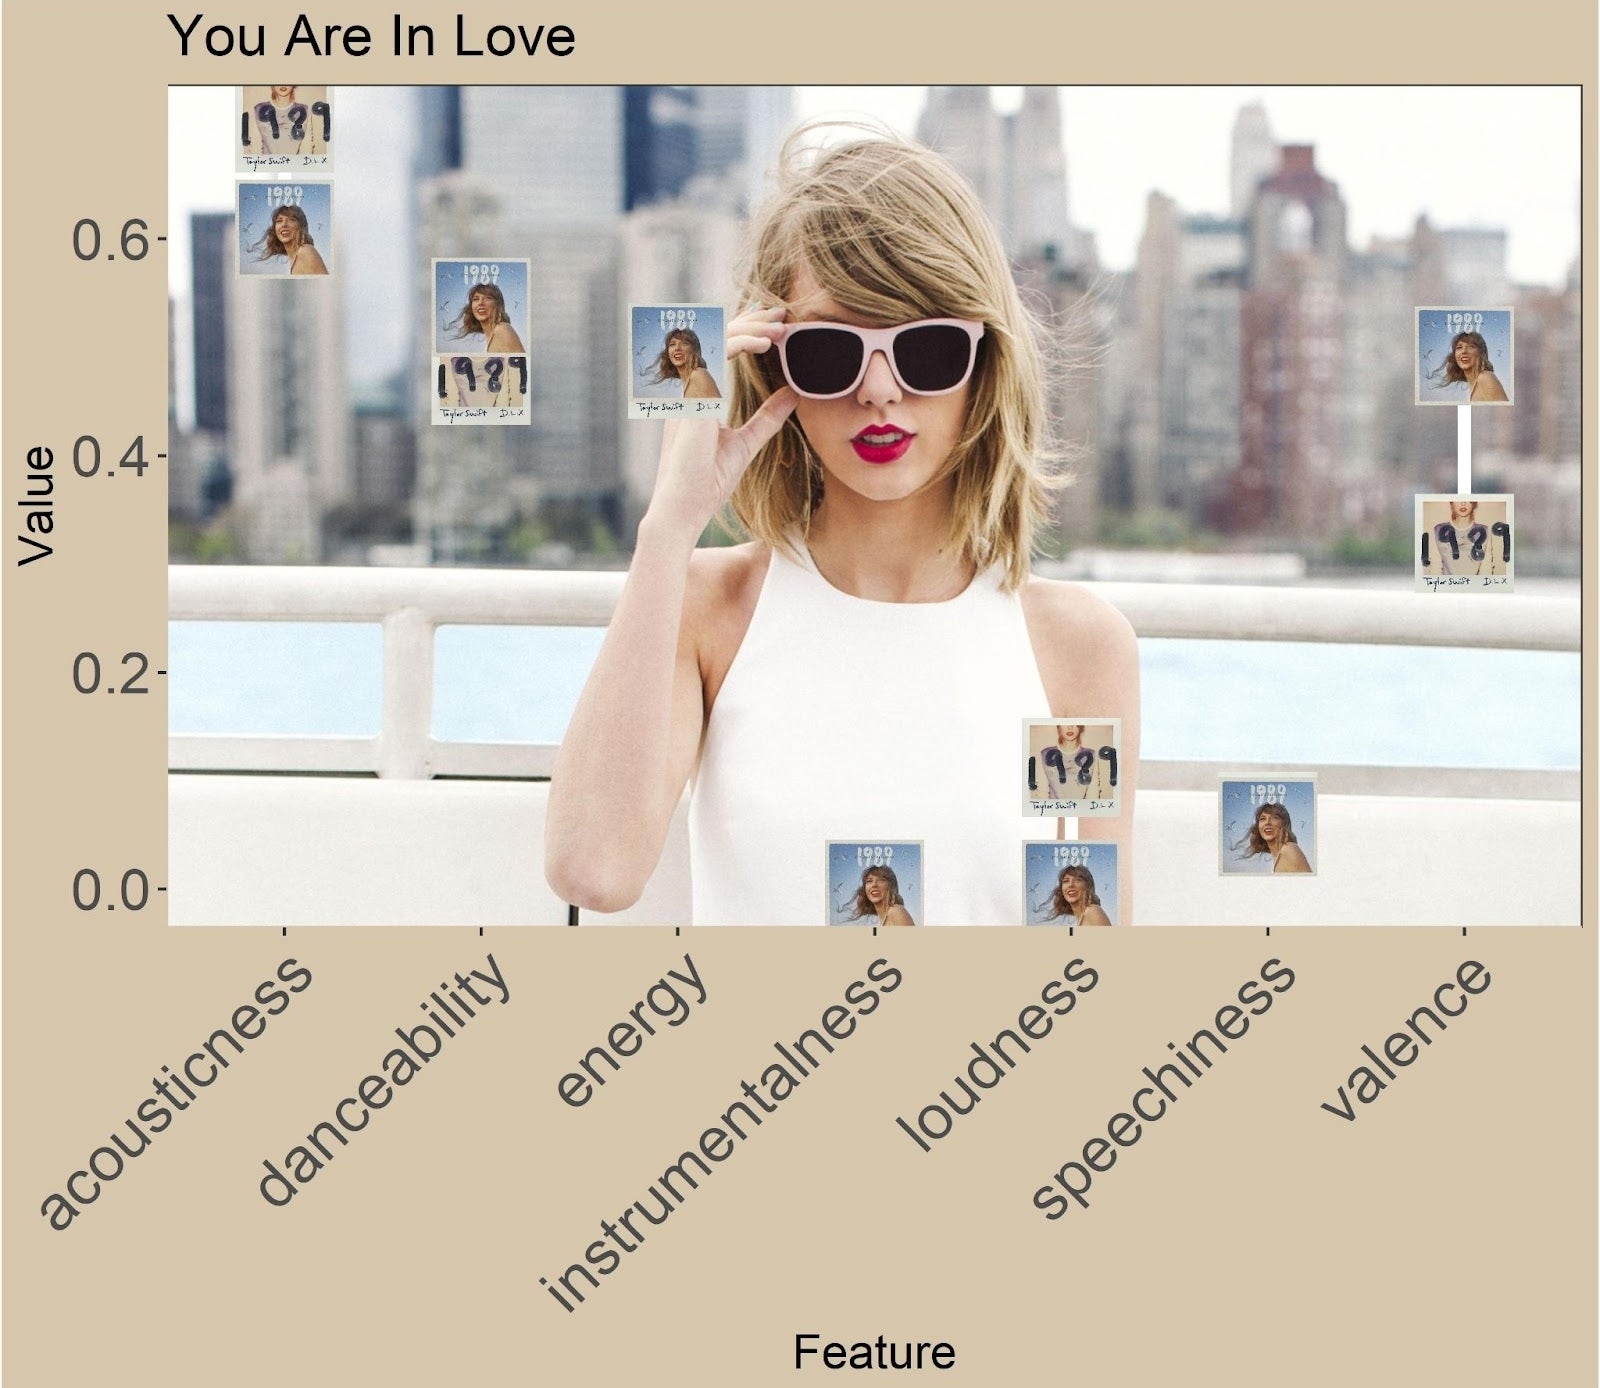
17 — "You Are In Love"
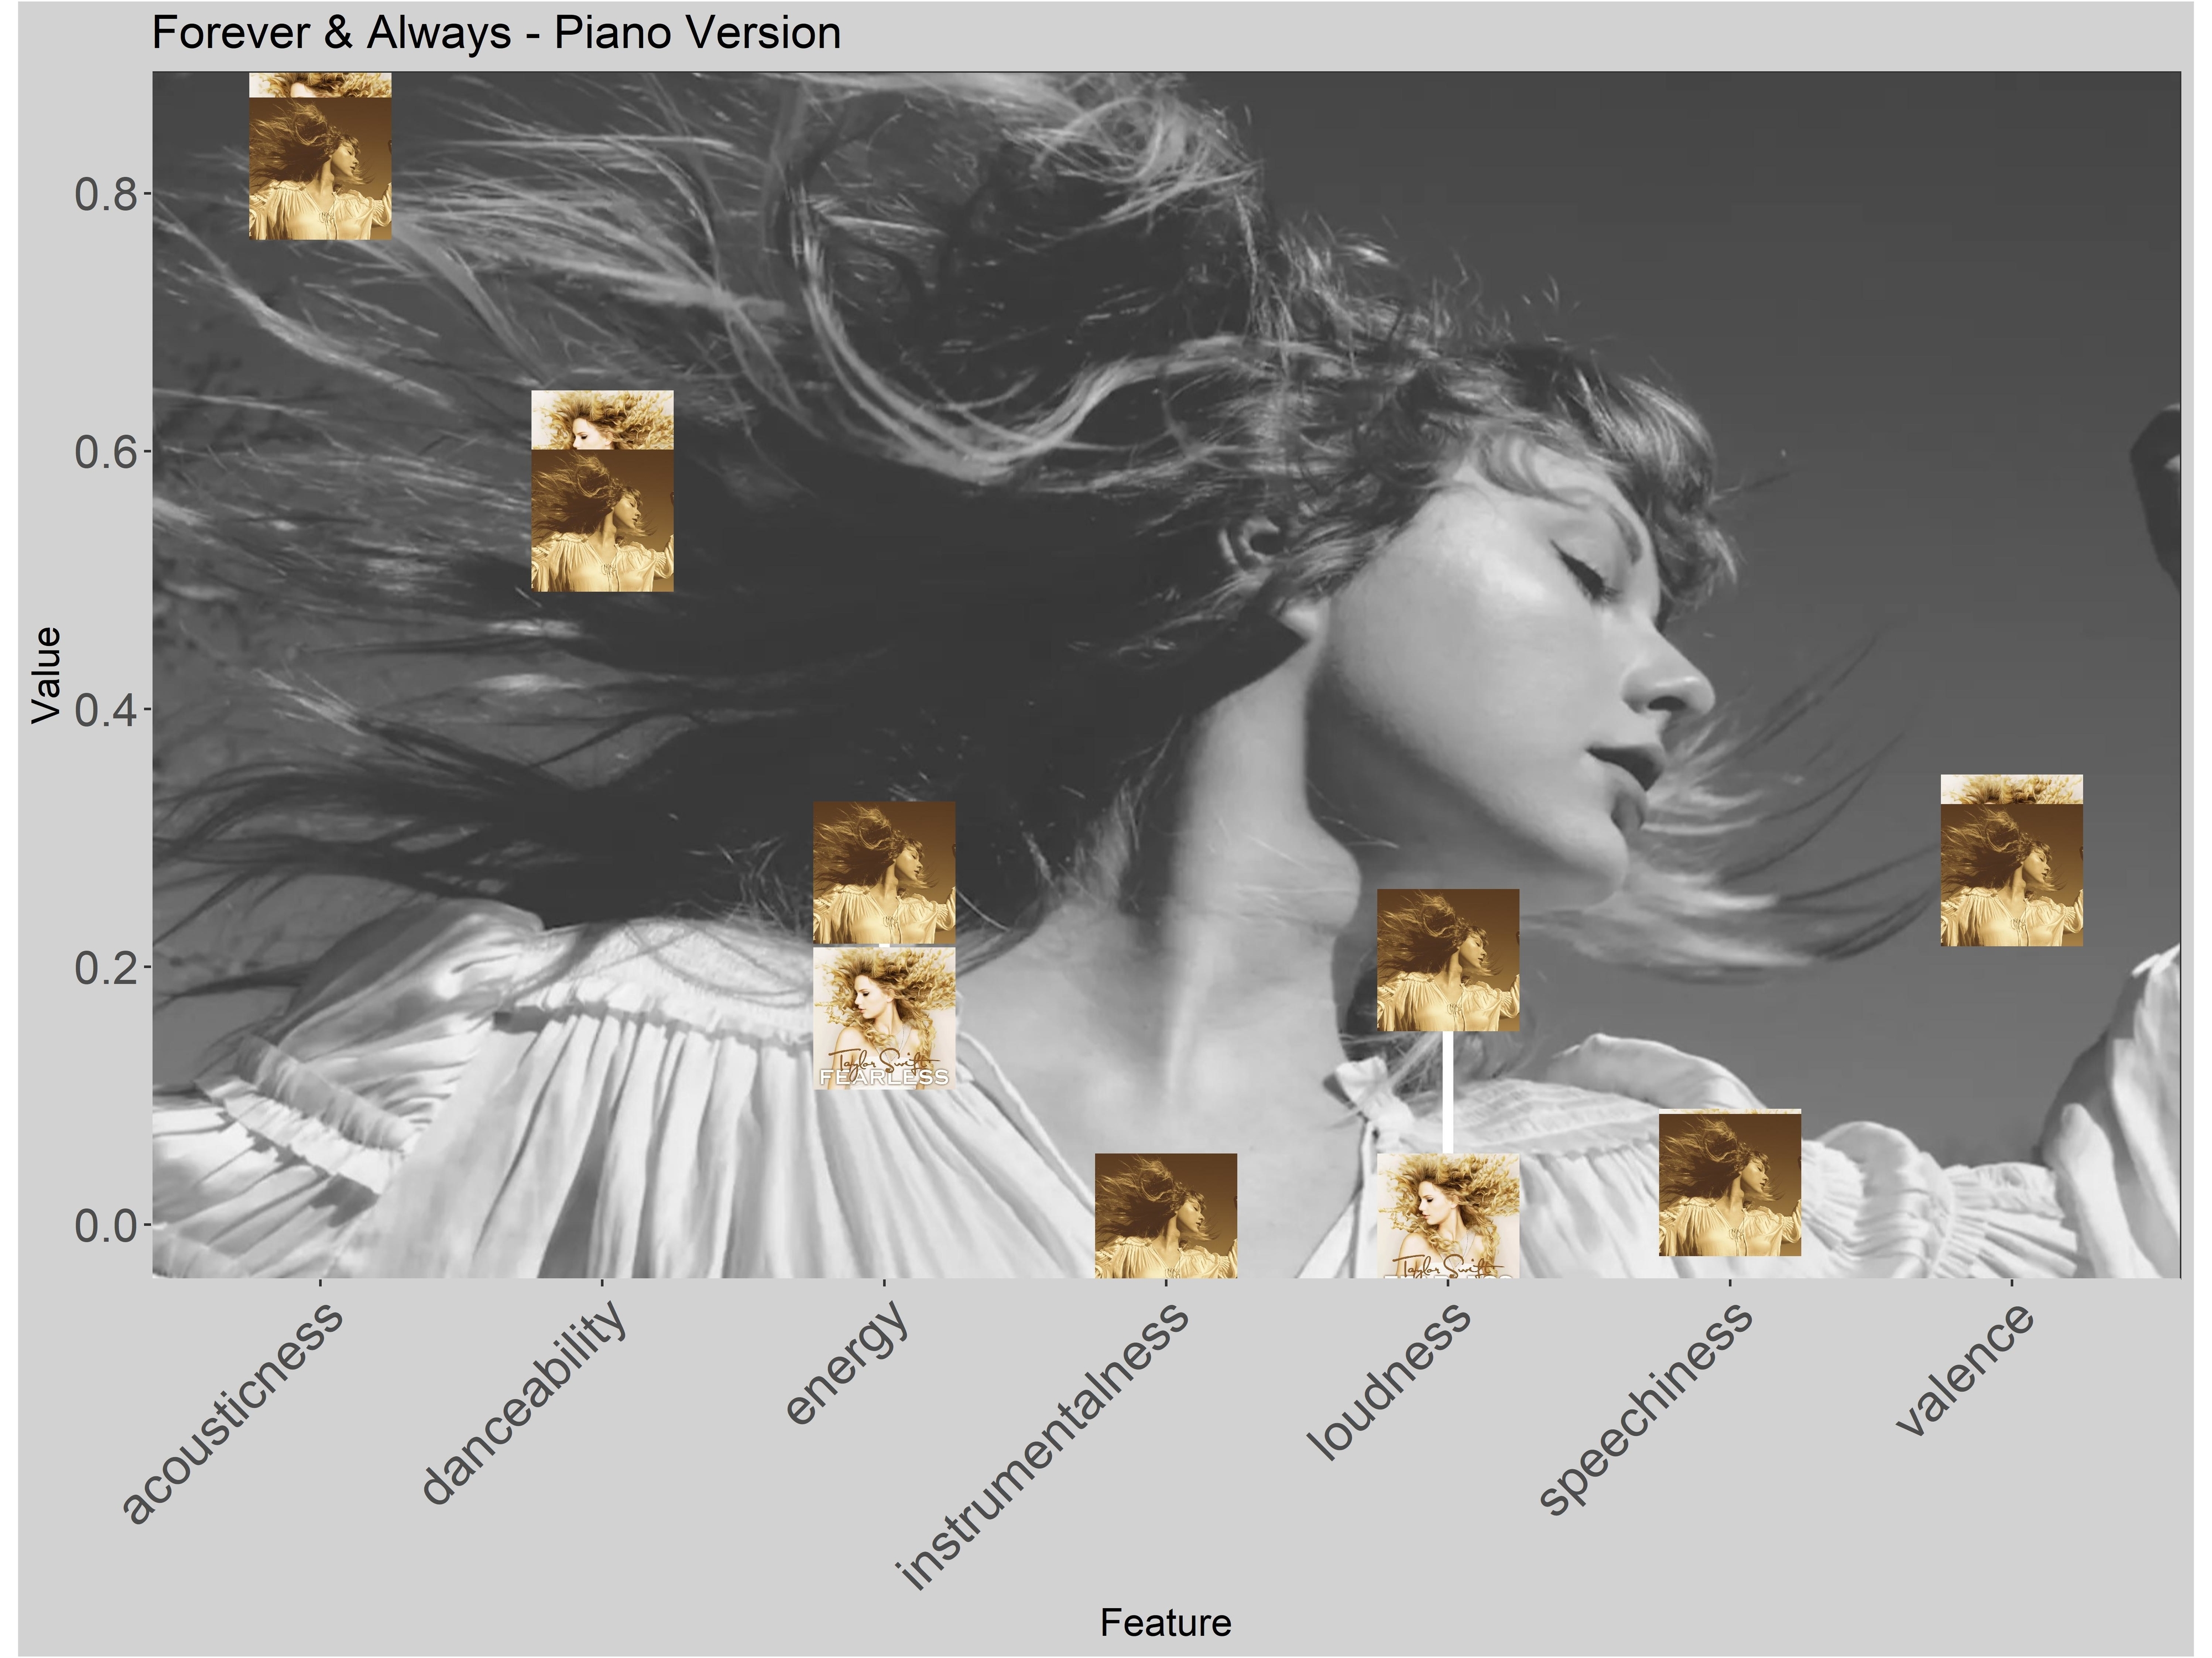
16 — "Forever & Always (Piano Version)"
15 — "Last Kiss"
14 — "Style"
13 — "Clean"
12 — "Out of the Woods"

11 — "State Of Grace (Acoustic Version)"
10 — "Everything Has Changed"
9 — "I Know Places"
8 — "All Too Well"
7 — "Superstar"
6 — "Red"
5 — "White Horse"
4 — "Girl at Home"
3 — "Breathe"
2 — "Stay Stay Stay"
1 — "This Love"
Now, here's the 20 pairs that are the most similar to each other (and it's incredible how Taylor was able to replicate these audio qualities so closely):
20 — "Shake It Off"
19 — "New Romantics"
18 — "I Almost Do"
17 — "We Are Never Ever Getting Back Together"
16 — "Tell Me Why"
15 — "Starlight"
14 — "Sad Beautiful Tragic"
13 — "Long Live"
12 — "Sparks Fly"
11 — "Fearless"
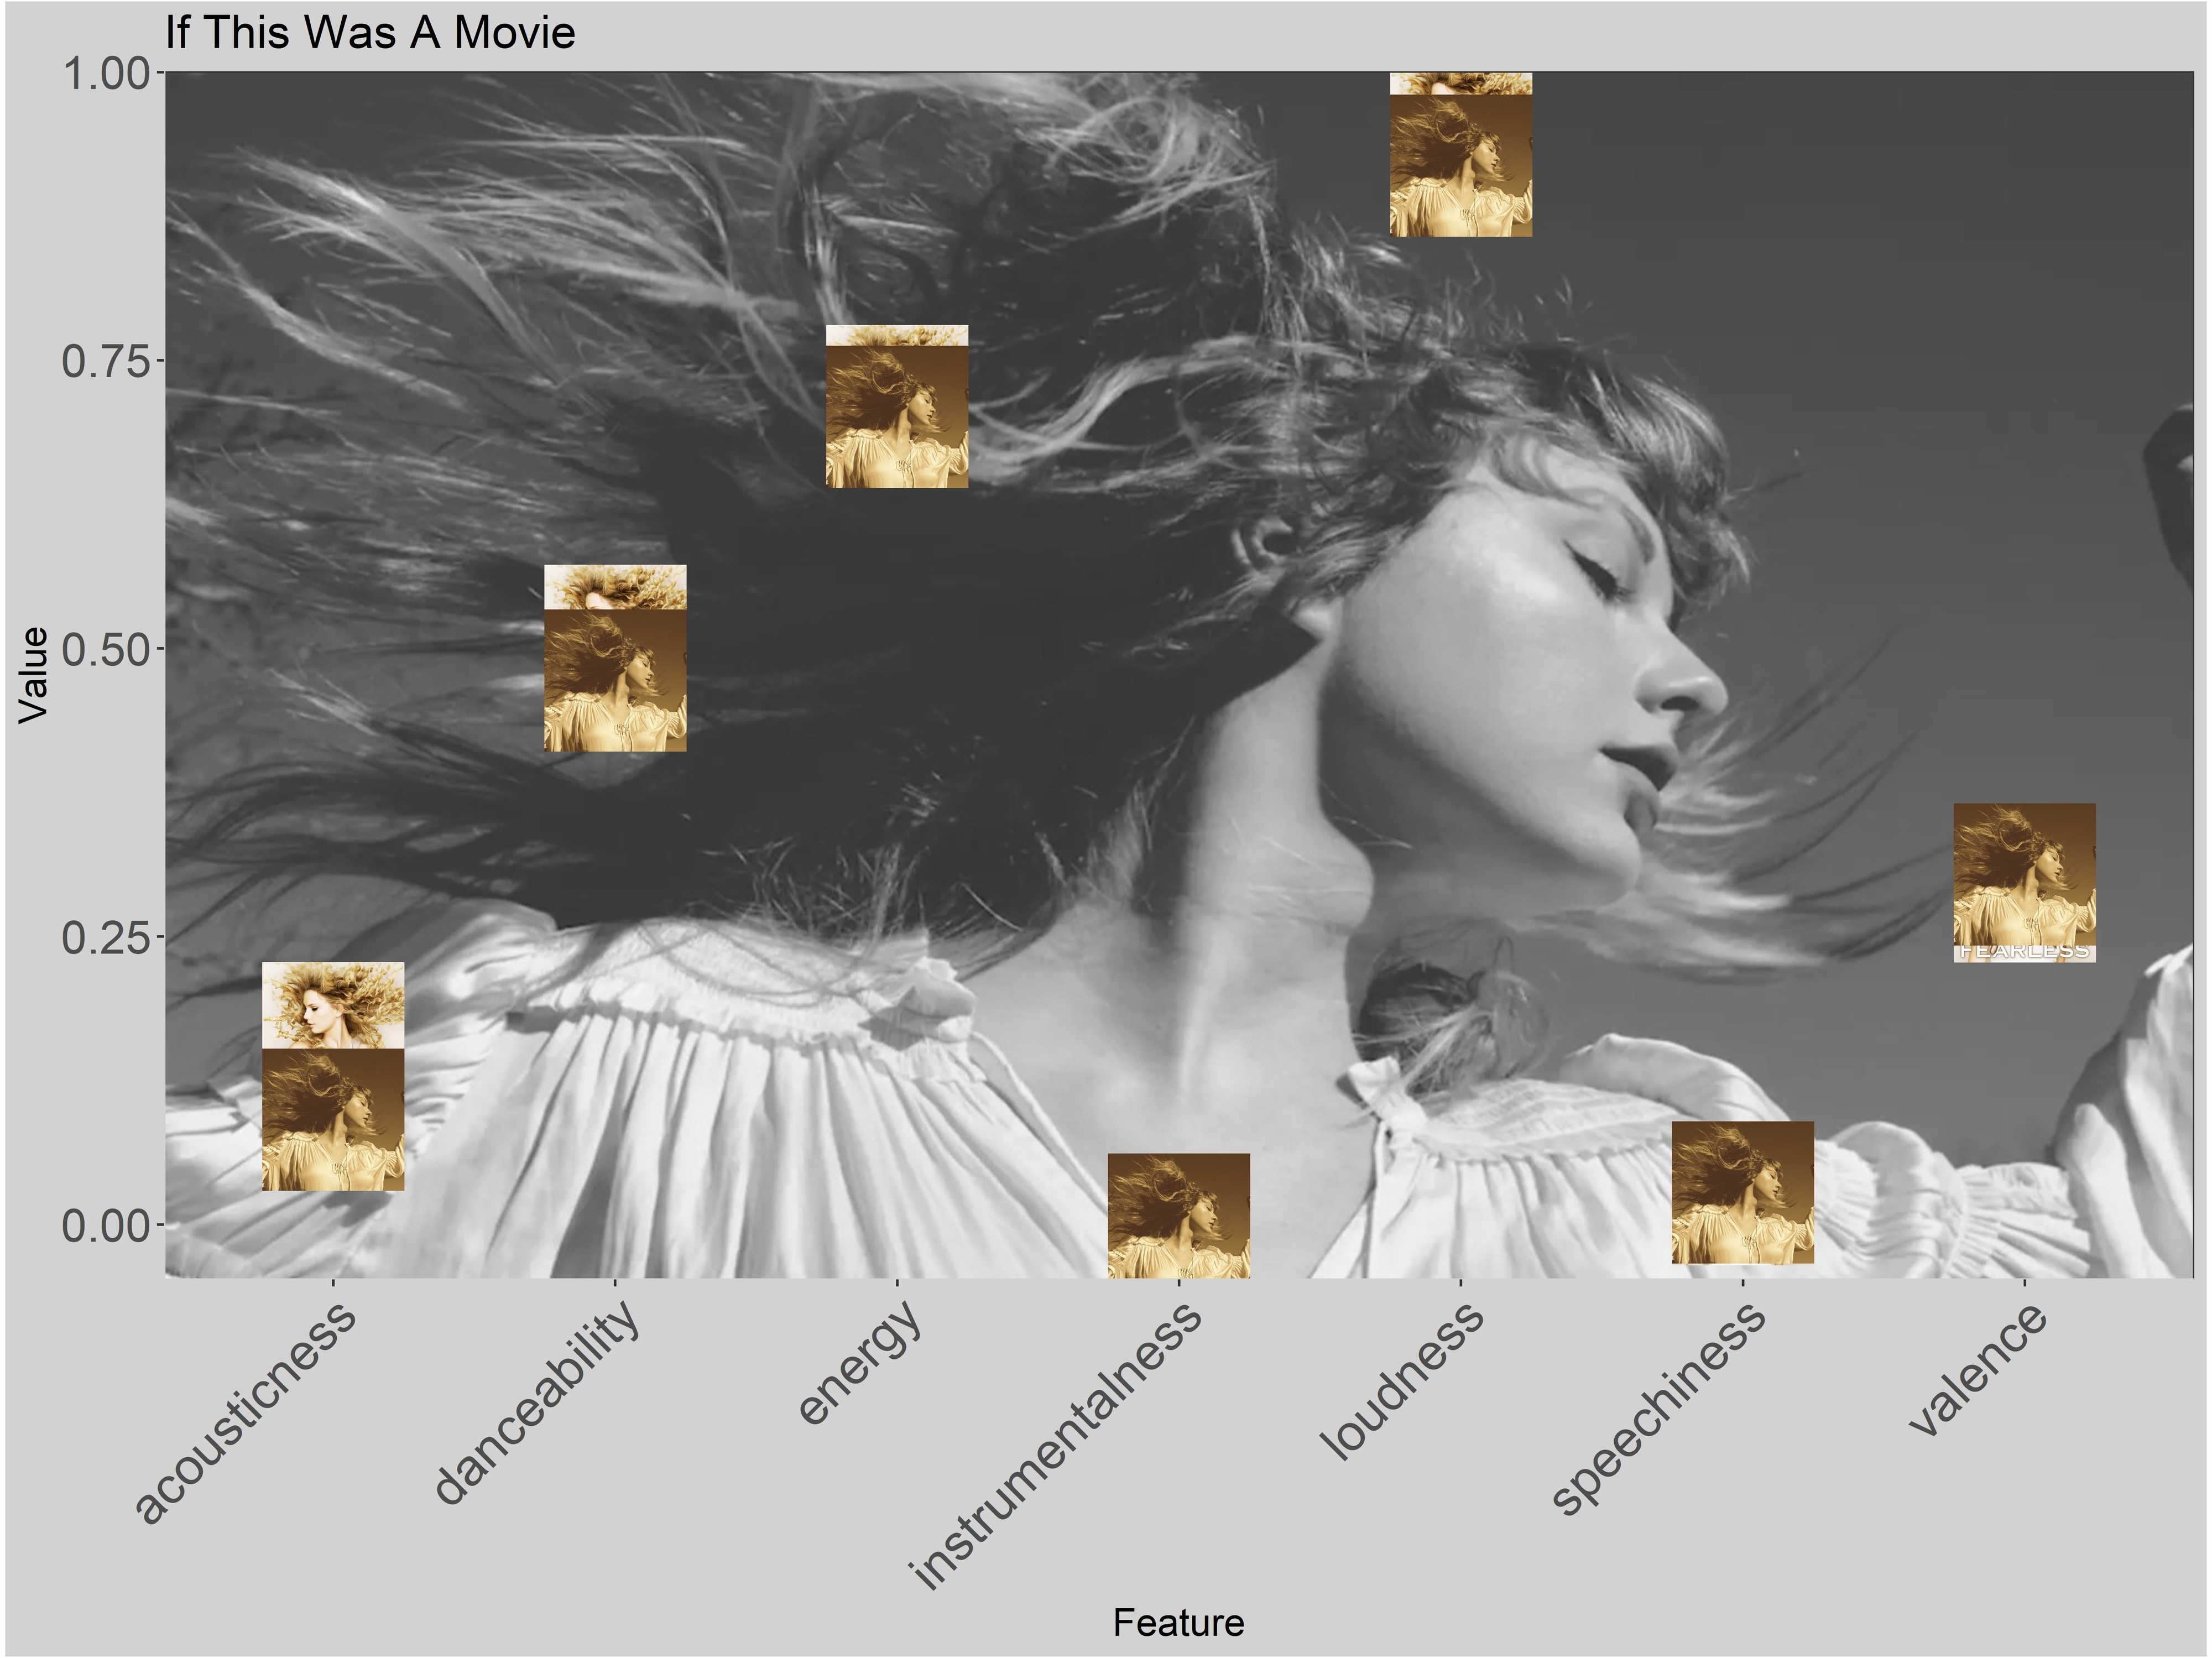
10 — "If This Was a Movie"
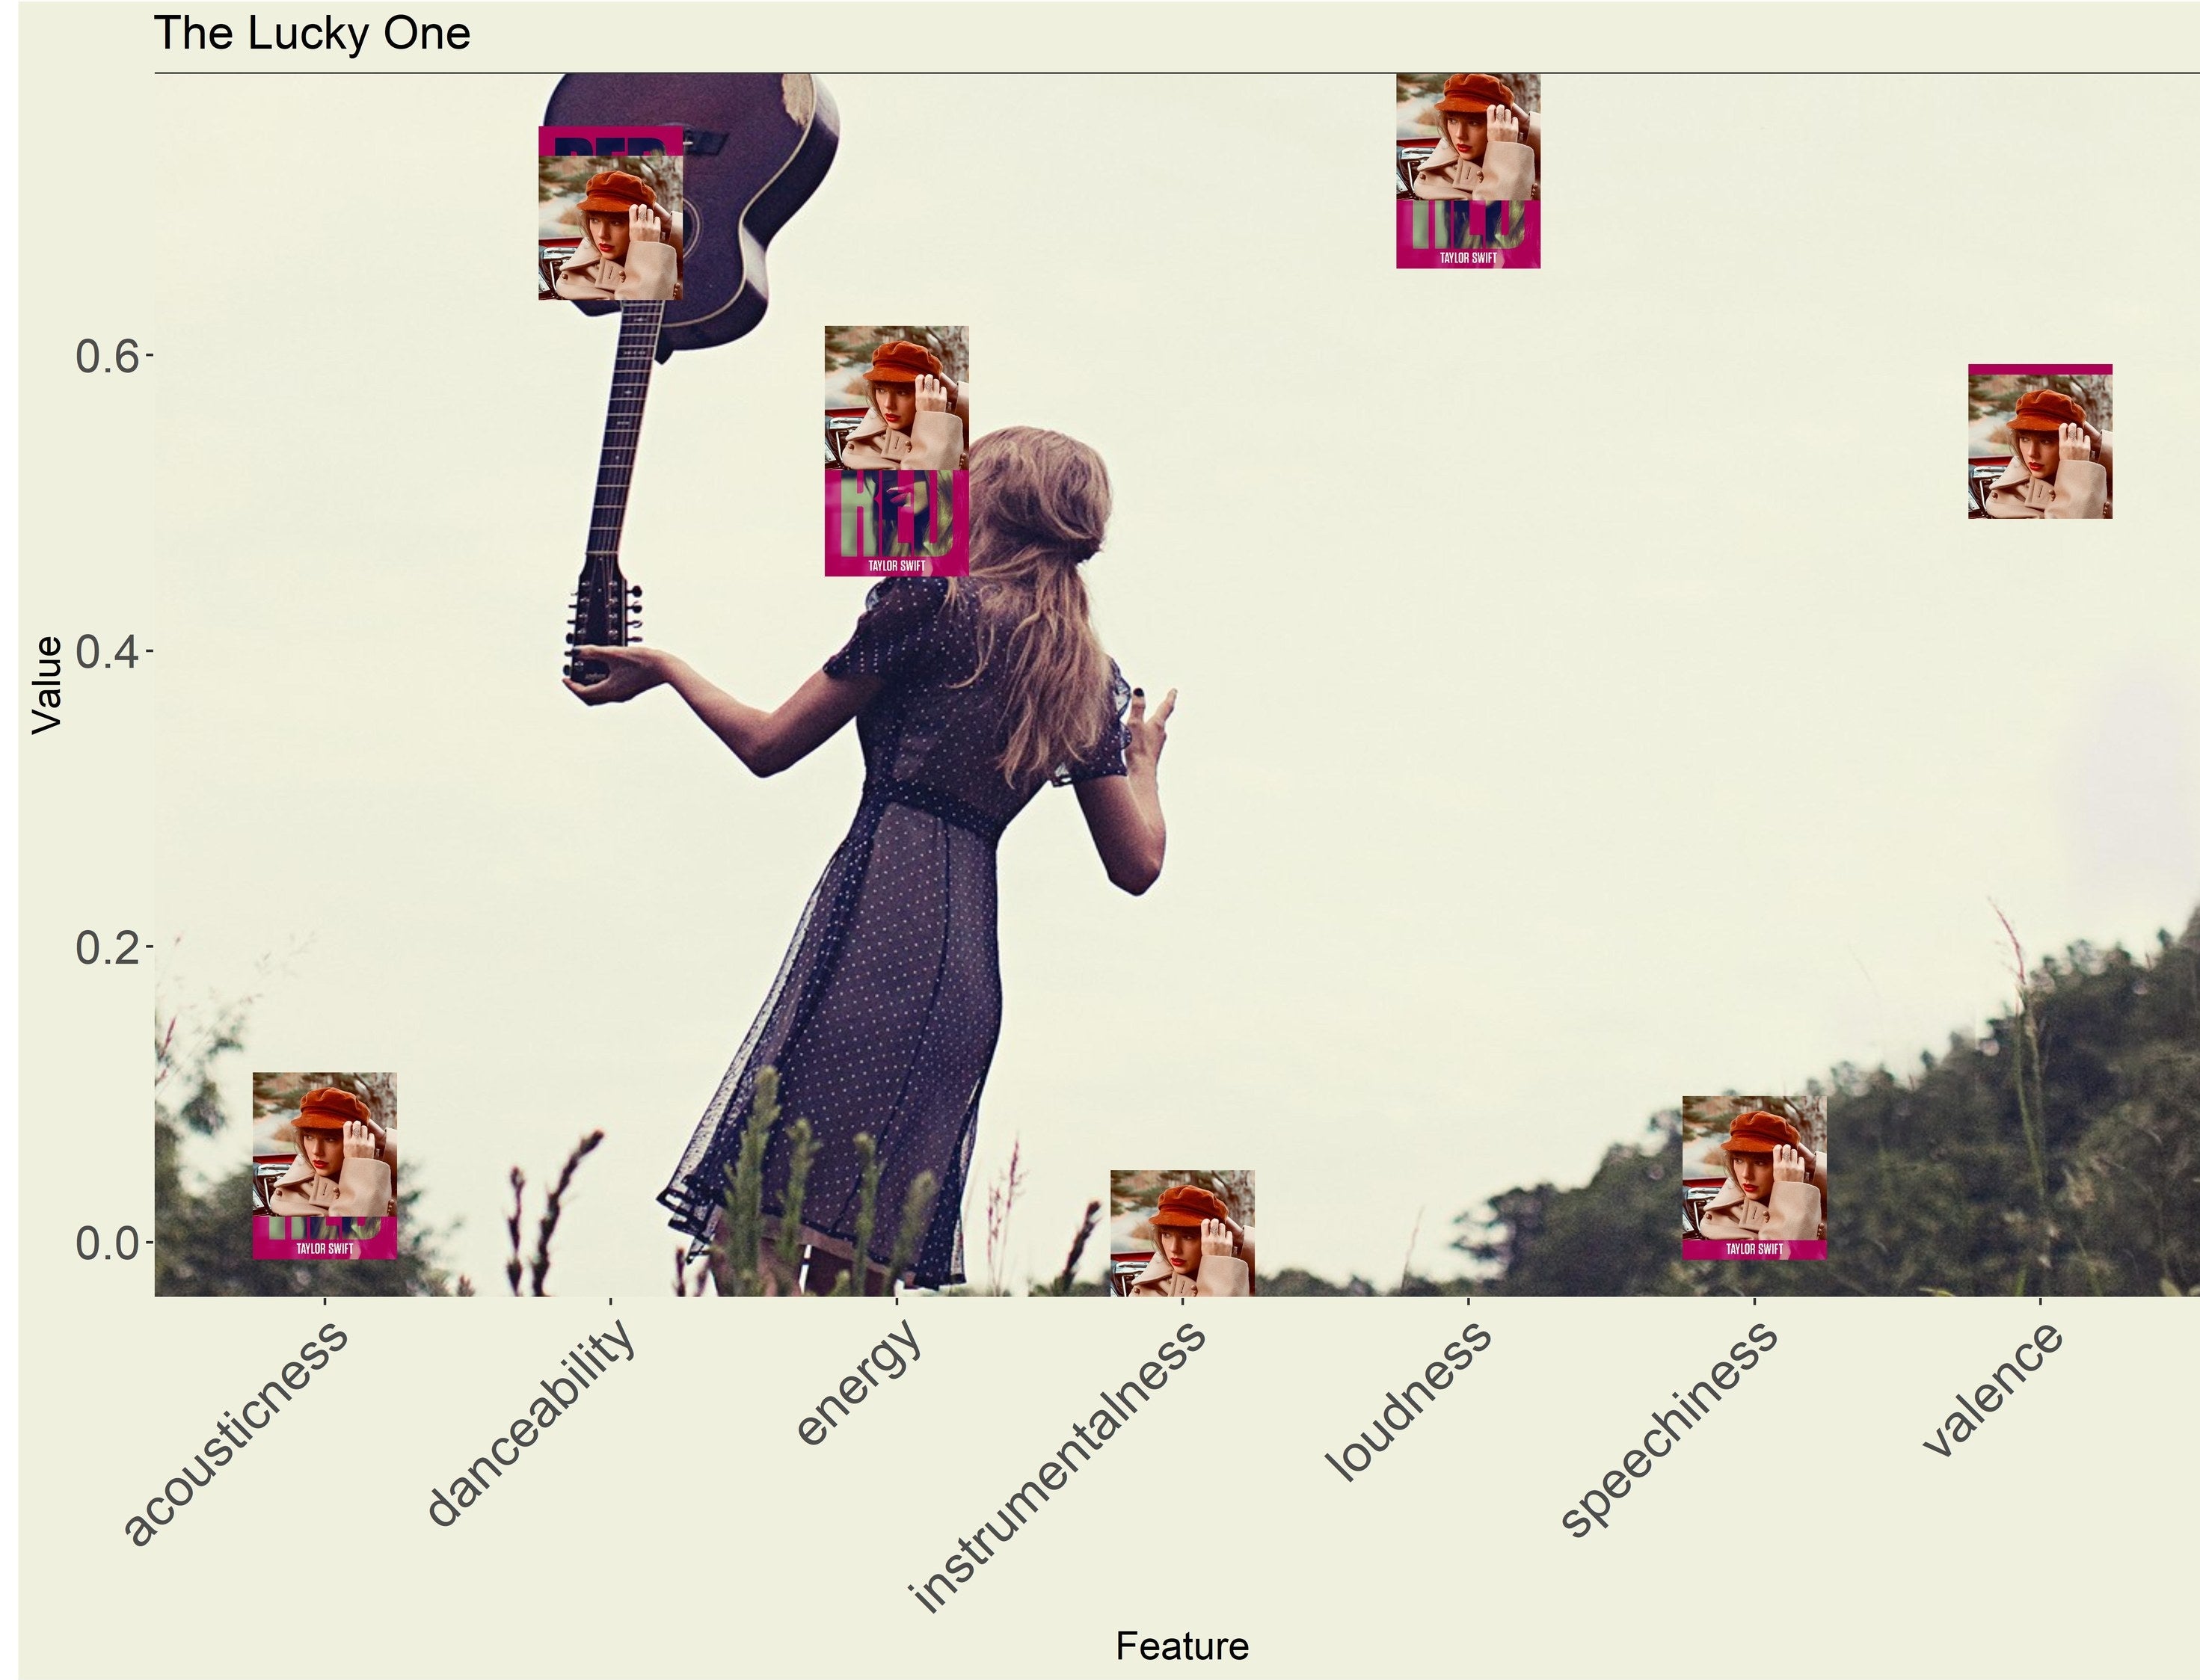
9 — "The Lucky One"
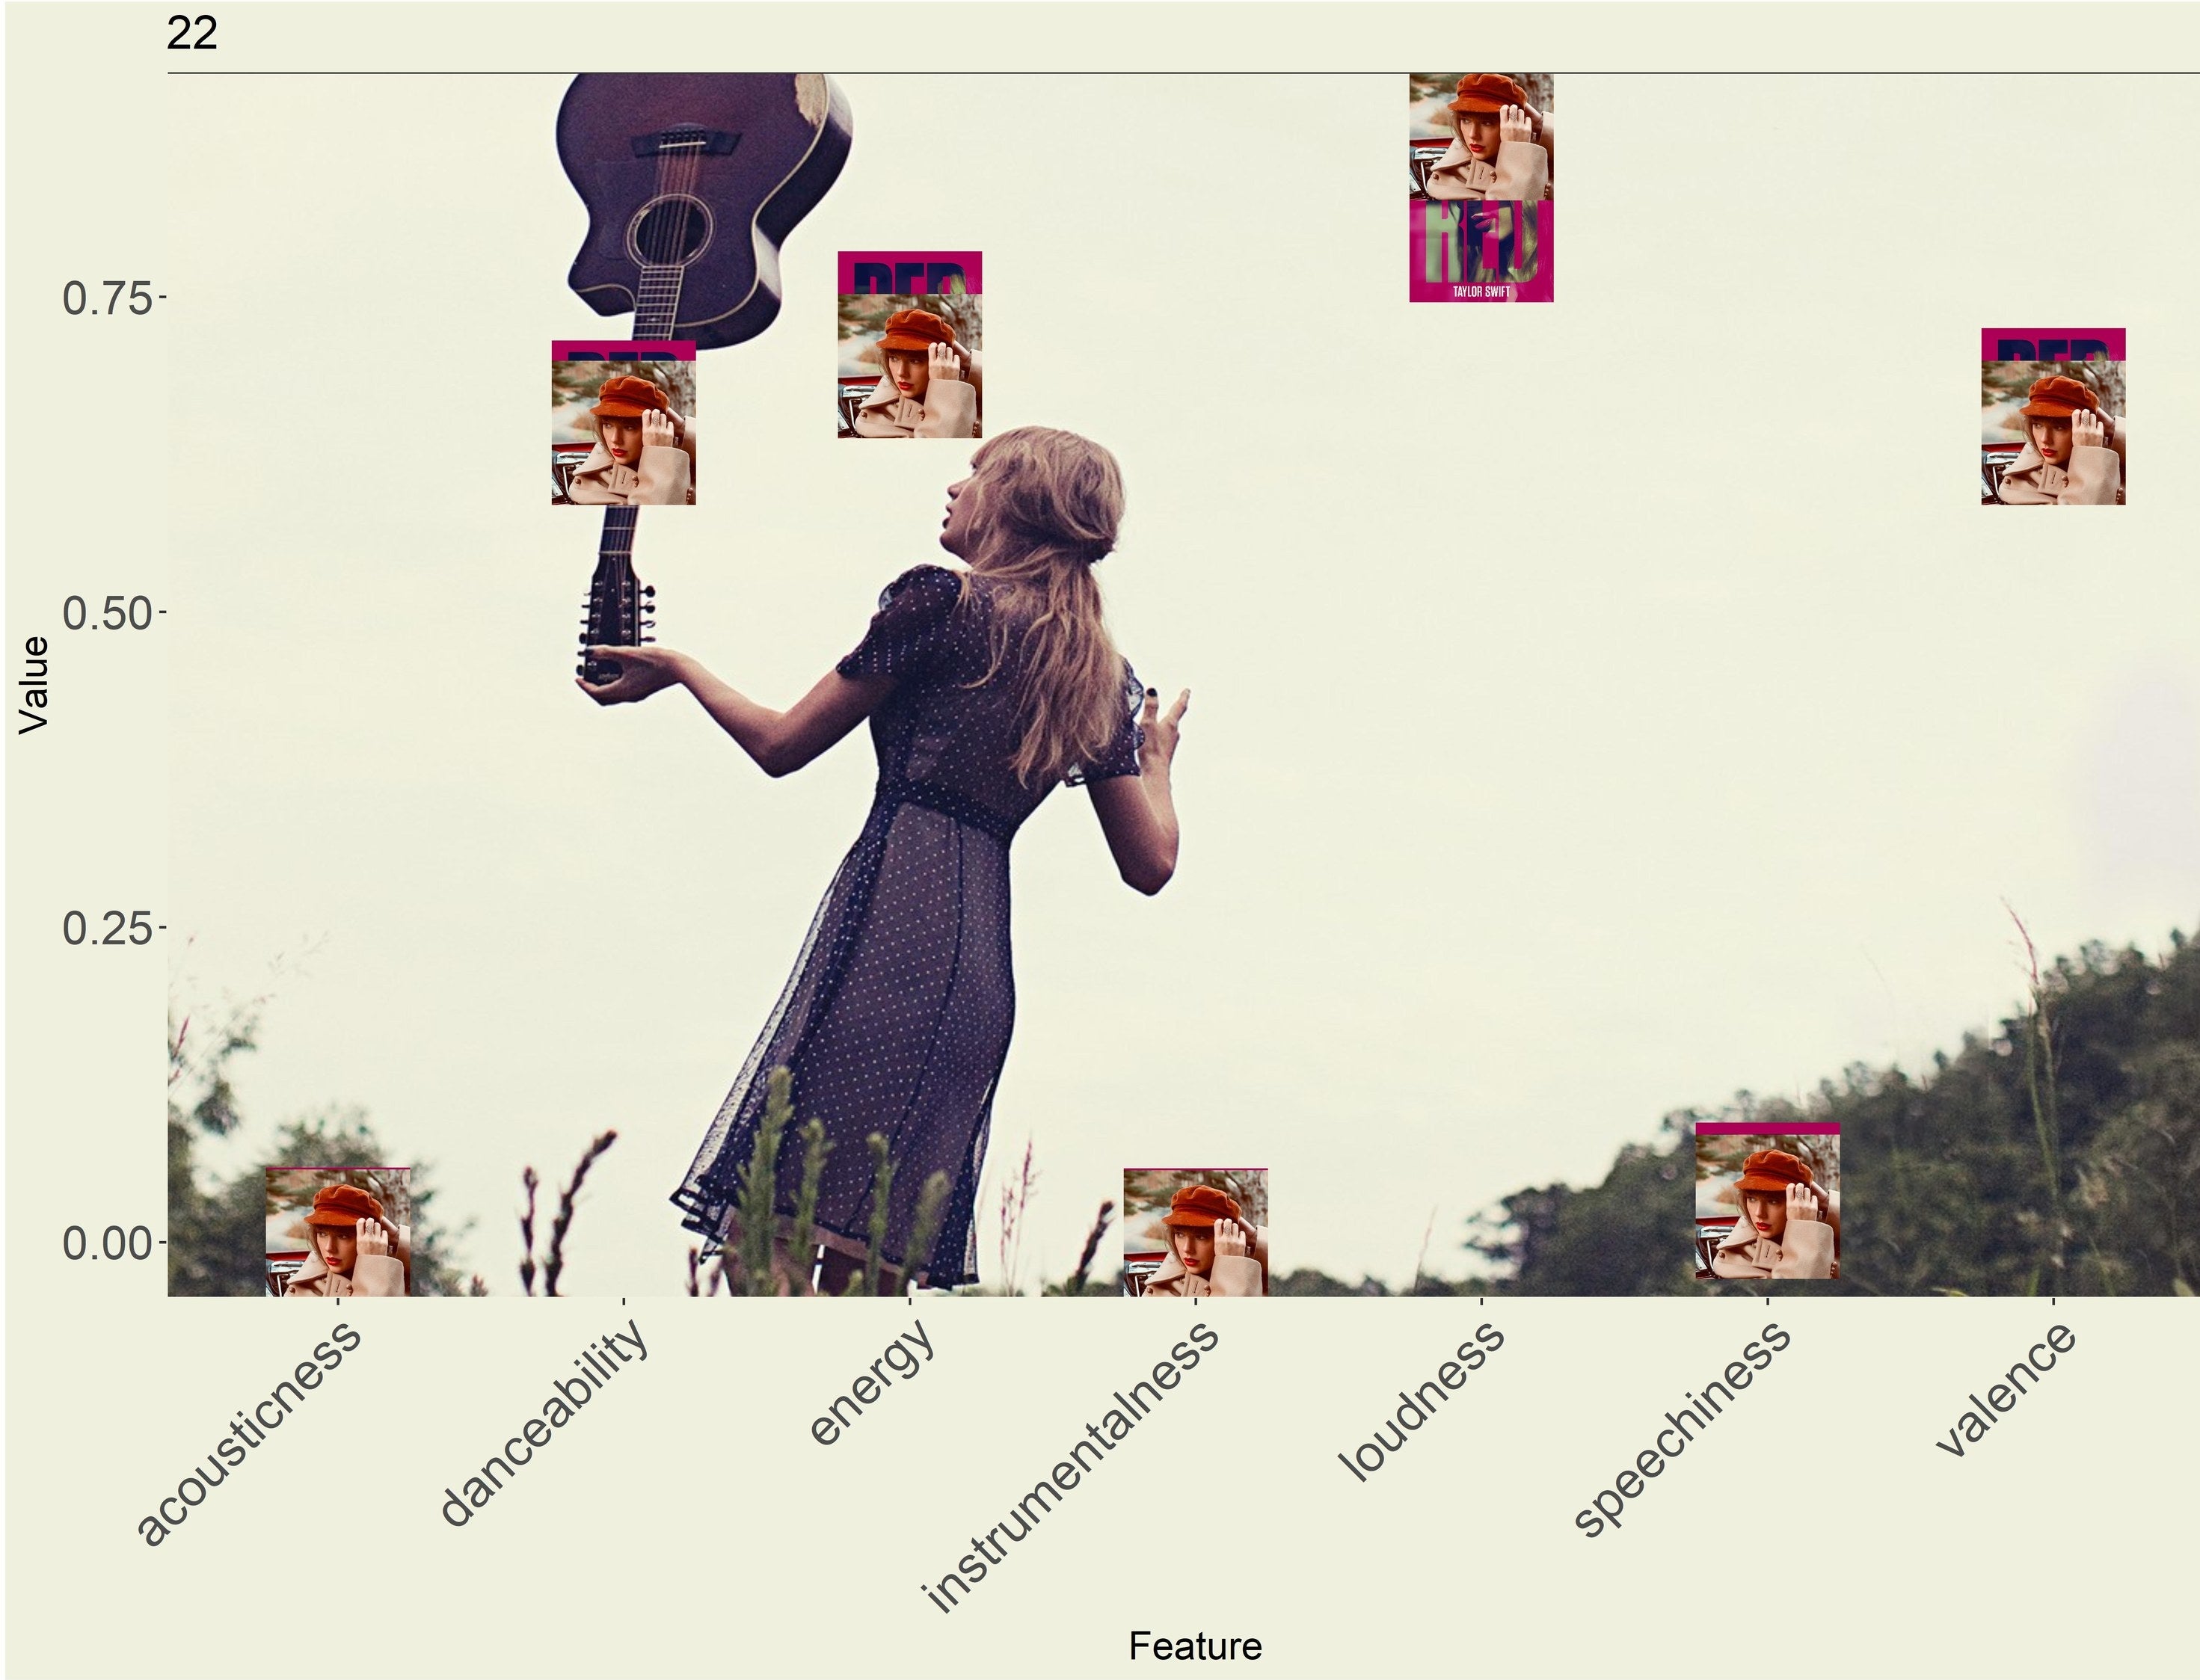
8 — "22"
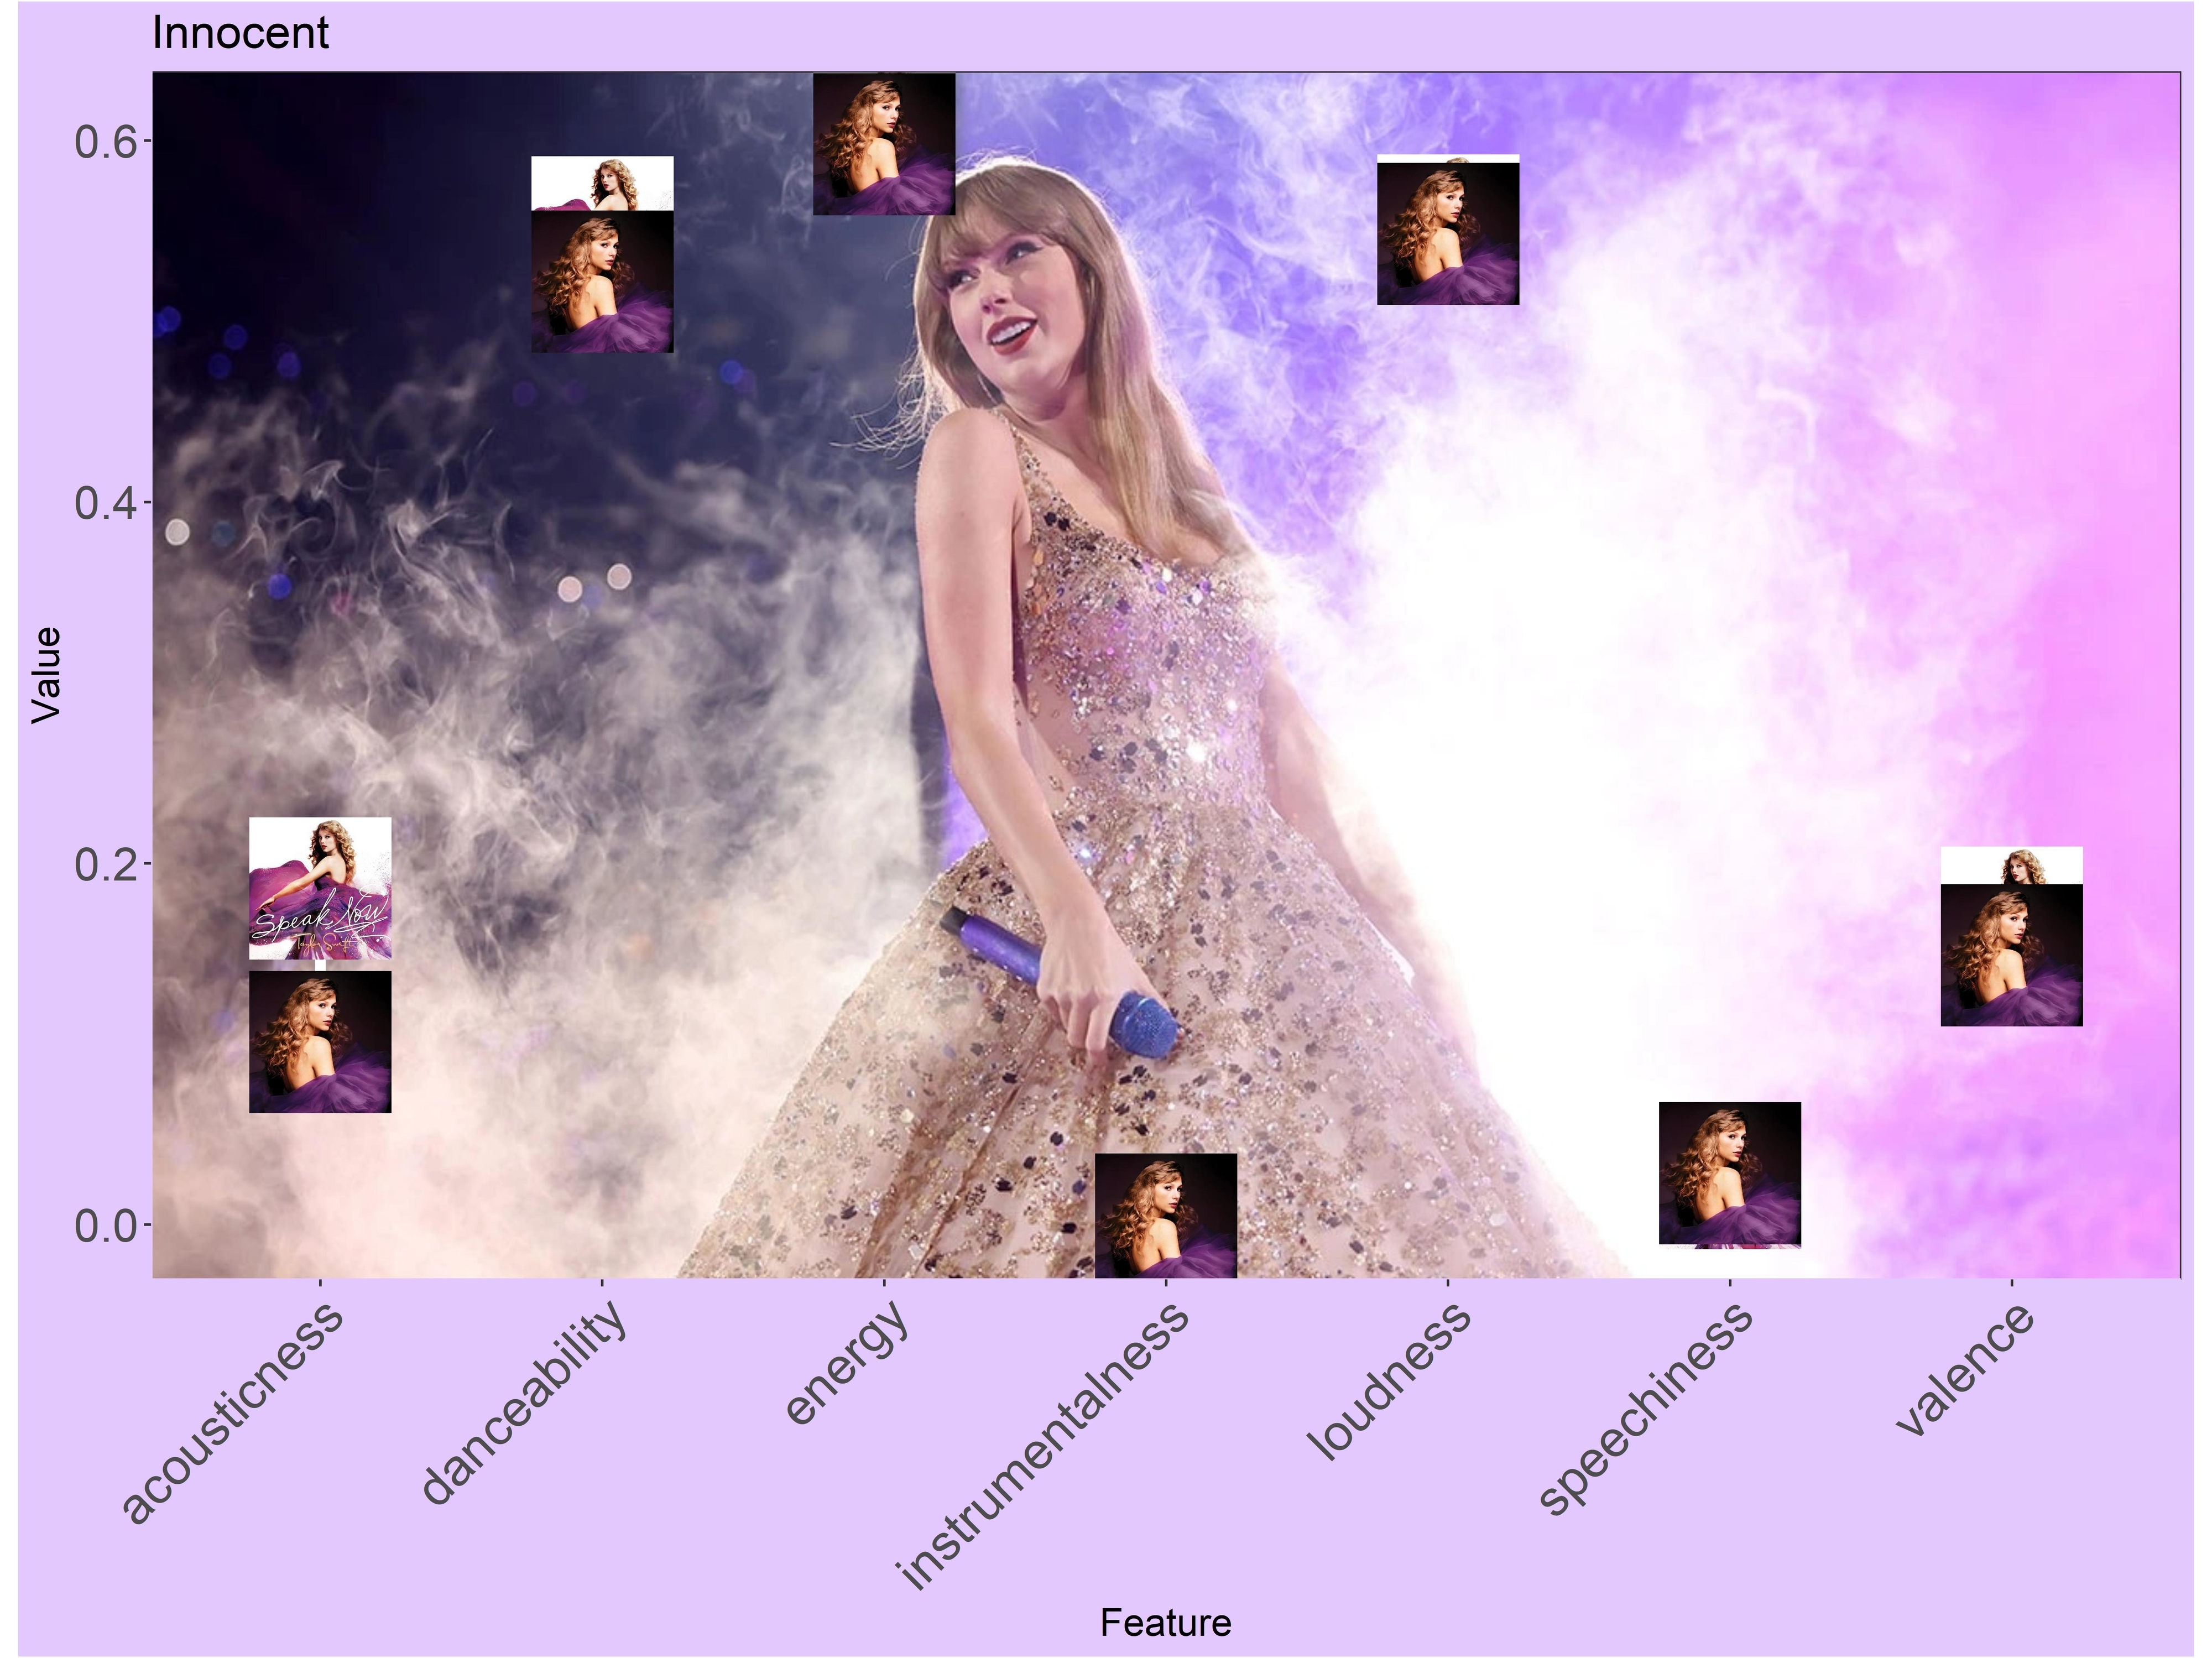
7 — "Innocent"
6 — "Fifteen"
5 — "How You Get the Girl"
4 — "All You Had to Do Was Stay"
3 — "Wildest Dreams"
2 — "Better Than Revenge"
1 — "Welcome to New York"
After comparing the audio characteristics of the songs, the results I found were thought-provoking! Other factors like lyric, melodic, and vocal changes would be an addition for deeper analysis, though more difficult to quantify.
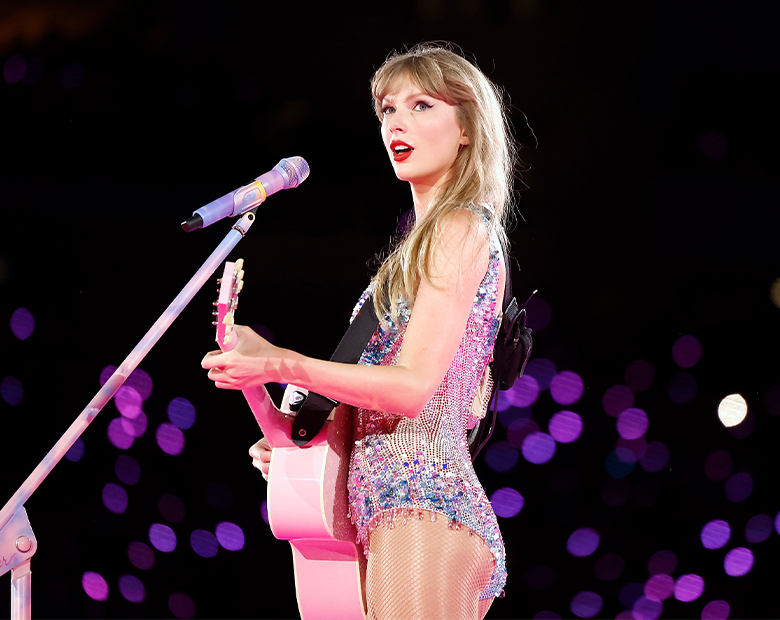
Which Taylor's Version track do you think has the biggest difference and which is the most similar? Let me know in the comments! Now, back to streaming 1989 (Taylor's Version)!

Share This Article