One Chart Explaining Why It’s Getting Hard To Blame Obama For The Economy
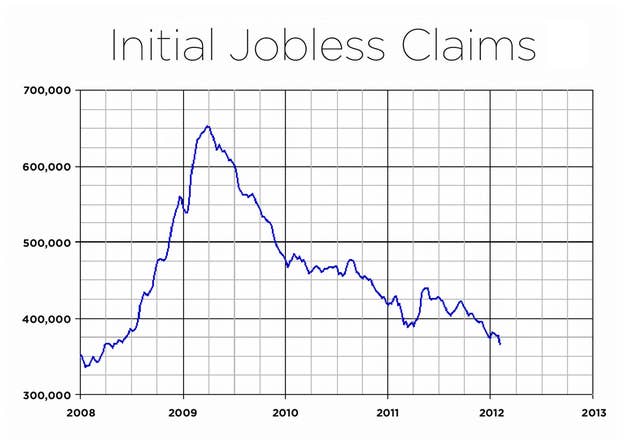
This chart tracks the four-week moving average of initial jobless claims, beginning in January of 2008. And while the economy isn’t booming, it’s a vivid illustration that the labor market has, on Obama’s watch, been healing.
HOT ON
Facebook Conversations
15 Responses So Far
- andrewd12 thinks One Chart Explaining Why It's Get... is Win
- Reskankulous thinks One Chart Explaining Why It's Get... is Win
- Korinna Romero thinks One Chart Explaining Why It's Get... is Win
- Fyre thinks One Chart Explaining Why It's Get... is Win
- benr11 One Chart Explaining Why It's Get... and thinks it’s Win
- miesmuschel thinks One Chart Explaining Why It's Get... is Win
- brandont9 thinks One Chart Explaining Why It's Get... is Win
- mikec27 One Chart Explaining Why It's Get...
- LionessFeathers thinks One Chart Explaining Why It's Get... is Win
- fanaca One Chart Explaining Why It's Get... and thinks it’s Win
- animemando thinks One Chart Explaining Why It's Get... is Win
- buttcheeksunite thinks One Chart Explaining Why It's Get... is Win
- carlosv5 One Chart Explaining Why It's Get... and thinks it’s Win
- trattner One Chart Explaining Why It's Get... and thinks it’s Win
-
Ilaing a year agoI sent the chart into Ben Smith this morning. It is the four week moving average for initial jobless claims. I download the data into excel via Bloomberg links. I asked Ben to publish it without attribution. I work in finance and initial claims data is one of the more important numbers that I pay attention to. He data in the chart is easily verifiable at the BLS. The current trend in initial claims is indicative of a healing labor market. Any of you should feel free to regress claims data with other economic statistics. Here is a link to a past writeup from the impeccable John Hussman showing the relationship between initial claims and non-farm payrolls. http://www.hussman.net/wmc/wmc100222.htm Initial claims is a forward looking indicator for job growth. Yes, there are still too many people who are unemployed and their attachment to the labor force has decreased. And growth is still not good enough. But, the increasing momentum in the economy and the labor market makes Romney’s argument that Obama has made the economy worse rather difficult. Note: Hussman is currently predicting that the US is headed for a recession in 2012.
-
- lizzl One Chart Explaining Why It's Get...
- jameslas One Chart Explaining Why It's Get... and thinks it’s Win
-
- proud30lithuanian thinks One Chart Explaining Why It's Get... is Win
- bradb6 thinks One Chart Explaining Why It's Get... is Win
- matthewa8 thinks One Chart Explaining Why It's Get... is Win
- mariannen thinks One Chart Explaining Why It's Get... is Win
- Ethan One Chart Explaining Why It's Get...
- PaulSS thinks One Chart Explaining Why It's Get... is Win
- davidc60 One Chart Explaining Why It's Get...
- Rebecca DeWitt thinks One Chart Explaining Why It's Get... is Win
- mikaylamarie thinks One Chart Explaining Why It's Get... is Win
- SkelIy thinks One Chart Explaining Why It's Get... is Win
- dwaynep thinks One Chart Explaining Why It's Get... is Fail
- kevinv thinks One Chart Explaining Why It's Get... is Win
- scottr6 One Chart Explaining Why It's Get... and thinks it’s Win
-
-
- timbotown thinks One Chart Explaining Why It's Get... is Fail
- daveh17 thinks One Chart Explaining Why It's Get... is Win
- michizzle One Chart Explaining Why It's Get...
- Floobity One Chart Explaining Why It's Get... and thinks it’s Win
- xsmall thinks One Chart Explaining Why It's Get... is Win & LOL
- adaml12 One Chart Explaining Why It's Get... and thinks it’s Win
- smg7320 One Chart Explaining Why It's Get... and thinks it’s Win
-
-
Denis R. a year agoOk, for everyone who is not getting this: Those are Initial jobless claims. That means that this is the number of people WHO HAVE RECENTLY LOST THEIR JOBS. The fact that fewer people are losing their jobs, while at the same time we have other data showing that more jobs are being created MEANS THAT THE ECONOMY IS IMPROVING. Get it??? It ain’t rocket science, folks.
-
- Koolgecko91 One Chart Explaining Why It's Get...
- AmericanColleen thinks One Chart Explaining Why It's Get... is Win
-
- ManadaBitt thinks One Chart Explaining Why It's Get... is Win
- colinb9 One Chart Explaining Why It's Get...
- nat82 thinks One Chart Explaining Why It's Get... is Win
- firedeveryday One Chart Explaining Why It's Get... and thinks it’s Win
- r0xmyface0ff thinks One Chart Explaining Why It's Get... is Win
- north86 thinks One Chart Explaining Why It's Get... is Win
- roxywilde thinks One Chart Explaining Why It's Get... is Win
- soulstand thinks One Chart Explaining Why It's Get... is Win
- mandabear82 thinks One Chart Explaining Why It's Get... is Win
- xtalcase One Chart Explaining Why It's Get... and thinks it’s Win
- tauhids thinks One Chart Explaining Why It's Get... is Fail
- andrewh35 thinks One Chart Explaining Why It's Get... is Win
- audriusk thinks One Chart Explaining Why It's Get... is Win
- malik thinks One Chart Explaining Why It's Get... is Win
- justino3 thinks One Chart Explaining Why It's Get... is Fail
- deaddrift One Chart Explaining Why It's Get... and thinks it’s Old & Win
- nathanjh thinks One Chart Explaining Why It's Get... is Win
- emmb thinks One Chart Explaining Why It's Get... is Win
- Em0987654321 thinks One Chart Explaining Why It's Get... is Win
- James Broof thinks One Chart Explaining Why It's Get... is Fail
- jasons14 thinks One Chart Explaining Why It's Get... is Win
- jamesr17 thinks One Chart Explaining Why It's Get... is Fail
- samb19 thinks One Chart Explaining Why It's Get... is Win
-
Douglas Heidland a year agoWithout having a data source for reference I am going to extrapolate the following: This chart only uses inaccurate USBLS U3 employment reporting and not the more accurate U6 reporting which includes ALL the folks impacted by un/under employment. [That link is from 2008 BTW, which makes it all the more interesting] Here is more accurate information, with links, so you can do additional research yourself if you’d like: 2007 U-6: 8.5%
2008 U-6: 10.5%
2009 U-6: 16.2%
2010 U-6: 16.7%
2011 U-6: 15.9% Keep in mind these are averages of the monthly reports. Dig into those and you’ll have a true idea of how bad un/under employment really is in the United States. Finally, the statement of “it’s a vivid illustration that the labor market has, on Obama’s watch, been healing” is incorrect. Its Congress that really impacts these numbers, not the President. -
-
rslpsyched a year agoThis graph needs to define “jobless”. Is this everyone that does not have a full time job? Does it include part time or seasonal? Are people who gave up on looking for jobs considered jobless? Or just people who are looking but can’t get one? As a moderate liberal, I side with the sentiment behind the graph (i.e. Obama is doing a better job than people realize), but as a researcher the graph is really poor quality. It is uninterpretable at best and at worst it is misleading.
-
- Jack Shepherd thinks One Chart Explaining Why It's Get... is Win
- reddit.com readers just made One Chart Explaining Why It's Get... hotter
-
krisztinai a year agoUnemployment figures are skewed by nature. They exclude part-time workers, seasonal workers, and people who have stopped looking for work. No matter who is the president, the economic statistics do not truly represent the actual economic situation.
-
-
-
-
-
-
FlickMontana a year agoThat’s cool. Does it account for how the DoL counts these things? Like the part where if you stop hunting after two years, you are no longer considered part of the jobless claims? I’m not in that situation myself, but it seems that’s a thing.
-
- One Chart Explaining Why It's Get... is starting to get hot on Twitter Tweet It
- One Chart Explaining Why It's Get... is starting to get hot on Facebook Share It
- robbiec2 thinks One Chart Explaining Why It's Get... is Win & LOL


Special Reactions
Your Reaction?
React with an animated GIF!
READY. SET. REACT!
GET STARTED