One of the most surprising results of Election Day was Donald Trump winning Pennsylvania — a state that had voted for the Democrat in every election since 1988. As of the Pennsylvania Board of Elections’ latest tally, Trump leads Hillary Clinton by 57,588 votes. More than 60% of that margin comes from a shift in the vote in Philadelphia.
The Philadelphia data offers a particularly clear glimpse at what went wrong for Hillary Clinton: A block of voters who showed up for Barack Obama wasn’t inspired enough by her — or scared enough by Donald Trump — to show up. And as analysts pore over the results of the campaign, the numbers in Philadelphia offer perhaps the most devastating single data point for the Clinton campaign.
Yes, the city still went heavily toward the Democratic party; Clinton won more than 82% of the vote there. But she didn’t win by as much as she needed to. In 2012, Barack Obama beat Mitt Romney by 492,339 votes in Philadelphia. This election, Clinton is winning by only 457,399 — a decrease of nearly 35,000 votes.
The change partly owes to low turnout in the wards with the greatest proportion of black residents, who have traditionally favored Democratic candidates, a BuzzFeed News analysis found.
On the flip-side, turnout was generally up in wards where black residents were a minority — less than 40% of the population. As a result, overall turnout in the city is only down roughly 5,000 voters.
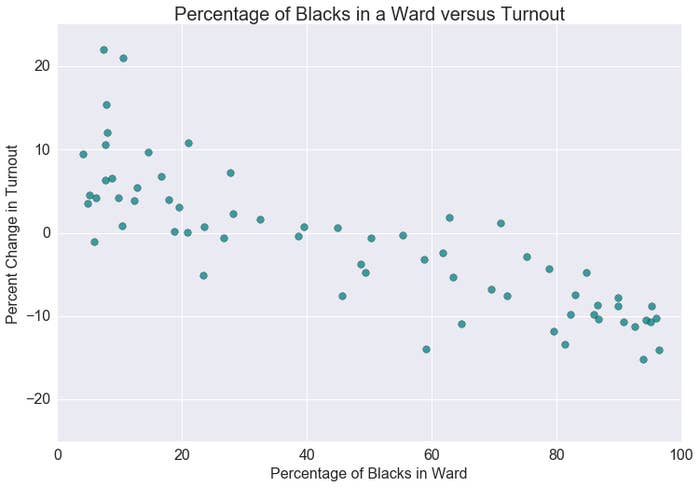
In fact, there is a strong correlation (Pearson’s r = -0.84, in statistics lingo) between the percentage of black residents in each ward (according to the 2010 Census) and the percentage change in turnout from 2012 to 2016. In general, the blacker the ward, the lower the turnout.
It’s hard to know exactly what’s causing this relationship. The change in turnout is likely not related to voter suppression efforts. Pennsylvania is not on the Brennan Center’s list of states that had implemented new voting restrictions between 2012 and 2016, and the ACLU received “no serious complaints” of voter intimidation on November 8, according to The Daily Beast.
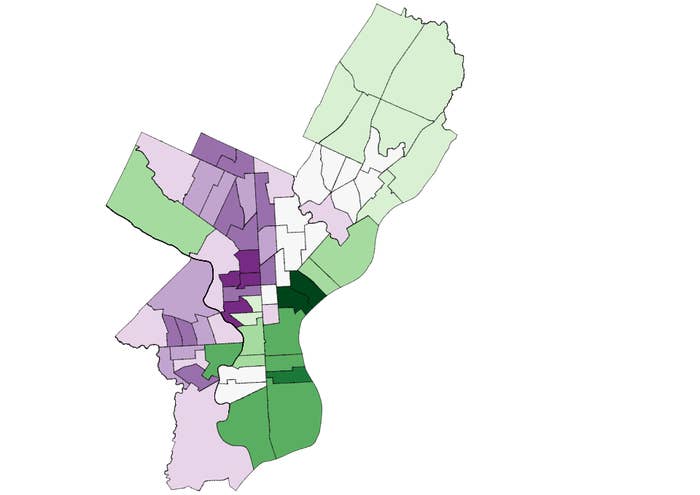
In the map below, you can see the turnout changes by ward. Purple indicates a decrease in turnout, while green indicates an increase: