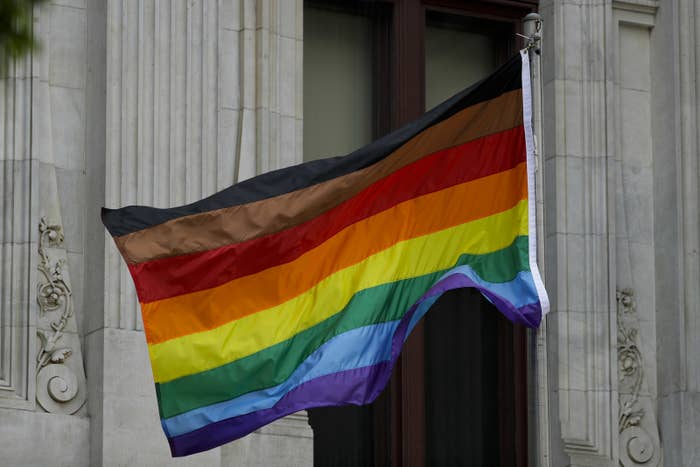
Most LGBT Americans don't want a brown and black stripe added to the rainbow pride flag, according to a new national survey. The poll found that gay men, whites, and baby boomers were most resistant to updating the flag in order to represent LGBT people of color — while younger and nonwhite LGBT people were more inclined to support the change.
The poll, taken by 880 LGBT adults from around the United States, found that 58% oppose the new stripes, while 42% support the change. The largest blocs of opposition were found among gay men and those over 50, with both groups opposing the additional colors 70% to 30%. White LGBT people oppose the change 62% to 38%.
The research was conducted by Whitman Insight Strategies and BuzzFeed News as part of a larger LGBTQ survey on life, politics, and identity. The margin of error overall is plus or minus 3.3%.
People of color have been at the vanguard of LGBT political advocacy and culture for decades, and yet, they have long been denied full recognition — and representation — for their contributions. The 2015 movie Stonewall, for example, portrayed a white man at the genesis of the modern LGBT movement while downplaying people of color and transgender women. LGBT bars have also been accused of racial discrimination.
Activists have sought a visible statement of racial inclusion in the flag, which was created by the artist Gilbert Baker in 1978. The rainbow banner originally had two additional stripes — pink and turquoise — to represent sex and magic, respectively, but those colors were dropped over the years. Debate around adding a black and brown stripe flared in June 2017 when the city of Philadelphia flew the flag with a brown and black stripe at City Hall and promoted the message "More color, more pride."
Many LGBT people support it. The survey found that LGBT people of color narrowly agree with updating the flag, 52% to 48%, while queer and transgender people support the change 64% and 69%, respectively.
The most pronounced split was generational. LGBT people between the ages of 18 and 29 appear to lean toward a more inclusive flag — 53% support and 47% oppose — while less than a fifth of baby boomers agree.
Support was stronger among lesbians and bisexuals than among gay men — 41% of lesbians and 47% of bisexuals said that they support the new stripes.
***
METHODOLOGY: Whitman Insight Strategies fielded an online quantitative survey among 880 self-identifying LGBT Americans through Research Now. Field dates were from May 24, 2018 to June 1, 2018. Respondents were screened to determine sex assigned at birth, gender identity, transgender identification, and orientation to appropriately define the audience. The makeup of the N=880 Self-Identified LGBT Americans includes 265 gay (30%), 129 lesbian (15%), 403 bisexual (46%), 51 transgender (6%), and 74 queer, nonbinary (8%) individuals.
The margin of error at the 95% level of confidence for the total sample is ± 3.3% and is slightly larger for any findings among the individual LGBT audiences.
