
Two years ago I wrote about how BuzzFeed thinks about data science. All the same basic tenets still hold today, and yet the metrics we cared about then are vastly different from the metrics we care about today. Why is that, and how did that change happen?
When the company strategy changes, our metrics also need to change
Our CEO, Jonah Peretti, started talking about BuzzFeed’s distributed strategy to internal teams in January 2015. Instead of focusing primarily on our website and apps, and using social networks as a way to send traffic to them, we were going to aggressively publish our content directly to platforms like YouTube, Facebook, and Snapchat. This meant that our daily, weekly, and monthly traffic reports tracking UVs and page views were obsolete. Platforms like YouTube and Facebook don’t regularly provide UVs to publishers, so we needed a new set of data to measure the overall reach and impact of the company.
This sounds fairly simple and straightforward, right? It is! And yet change is sometimes hard to implement, especially when your entire industry is used to doing things a certain way. Here are five things we talk about at BuzzFeed to help us most effectively think about data, and some results:
1. Re-anchor periodically
Re-anchoring is a process where we identify the ways we’ve historically done things (our anchors) and question their relevance. (BuzzFeed Motion Pictures President Ze Frank taught me about this.) Re-anchoring is hard for “successful” companies because the way you’ve done things is how you became successful in the first place.
Our current comScore metric of about 80 million UVs represents less than one-fifth of our actual global reach.
One result of re-anchoring is the realization that UVs as they are currently reported are decreasingly relevant to BuzzFeed. Internal UV numbers (using Adobe or Google Analytics) only measure unique browsers of our website, mobile apps, and Facebook Instant Articles. In the case of comScore, UVs measure our U.S. web, app, and Instant Article audience plus desktop YouTube viewers. comScore UVs as they are reported today do not include people who:
- watch our YouTube videos on mobile (over half of our YouTube views are on mobile)
- watch our videos and comics on Facebook, Snapchat Discover, Instagram, Yahoo, Tumblr, Vine
- use our website or mobile app outside the U.S.
We estimate that our current comScore metric of about 80 million UVs represents less than one-fifth of our actual global reach, based on ad hoc data provided by partners. Less than one-fifth. Re-anchoring doesn’t just require us to be flexible, it requires us to be unromantic. UVs were useful for a long time. Now let’s stop talking about UVs as a way to measure BuzzFeed’s audience.
2. Embrace complexity
The following GIF shows how BuzzFeed publishing has evolved.

Today BuzzFeed teams in 11 countries publish content on over 30 platforms in seven languages. For a publisher charged with collecting and understanding all the attendant data, the task has never been more complicated, more prone to error -- or more exciting. Even two years ago, when we all lived in a simpler media landscape, we believed there was no “one metric to rule them all.” Today that is even more true. To measure the overall reach of the company, we look at a combination of metrics that are available across platforms. Here is a sampling of what that data looks like.
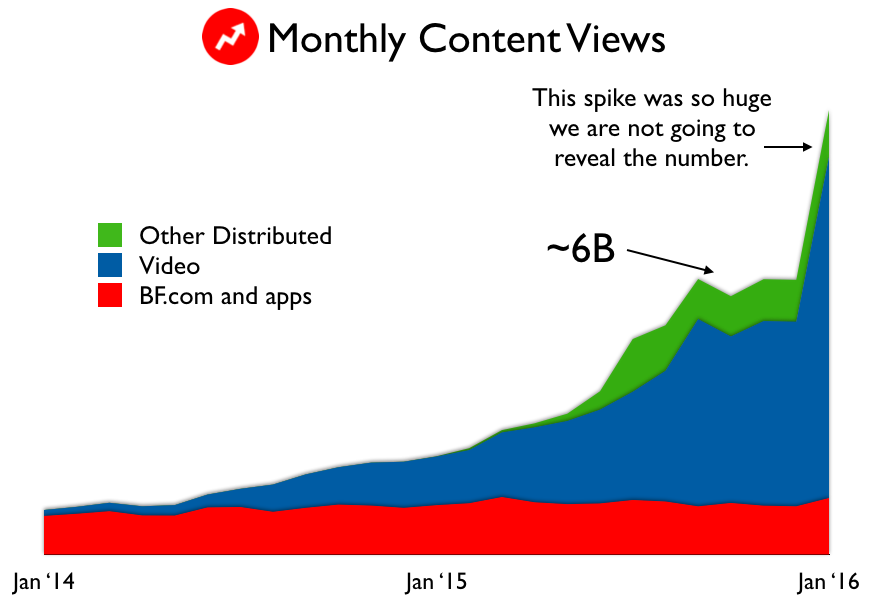
Content views are views of BuzzFeed content (videos, articles, lists, illustrations) regardless of the platform on which it lives. Not included are homepage or feed views or impressions of link promotions on social networks.
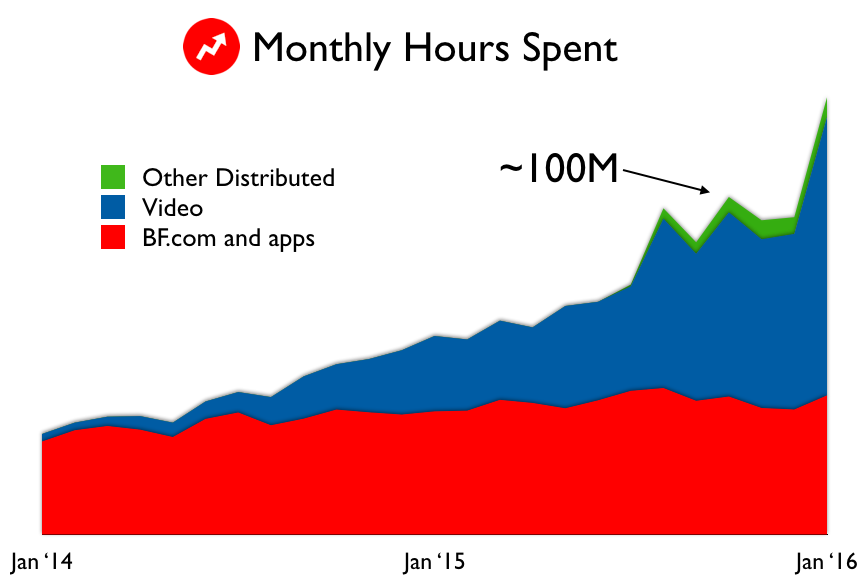
As we all know, Facebook, YouTube, and Snapchat all count video views in different ways. Hopefully though, they count minutes in the same way, so time spent helps us understand more about what our audience is doing.
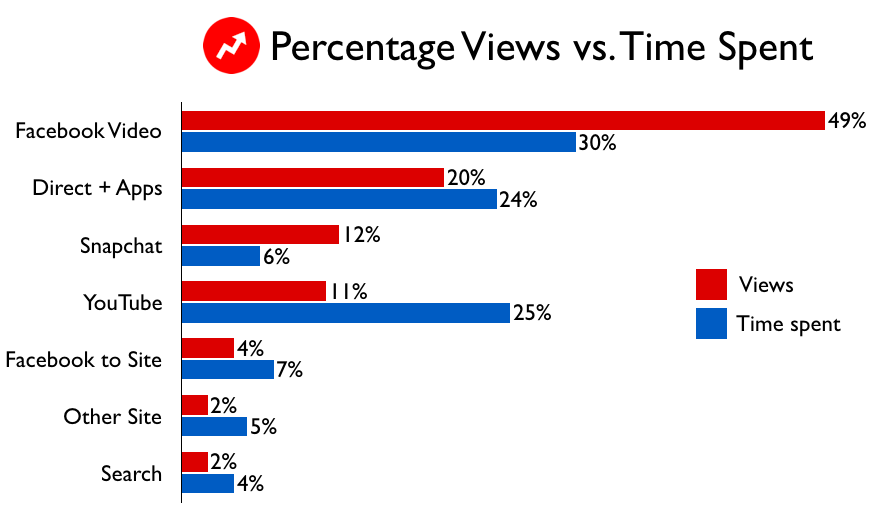
We can look at referral sources and platform locations to see which ones over-index and which ones under-index for time spent.
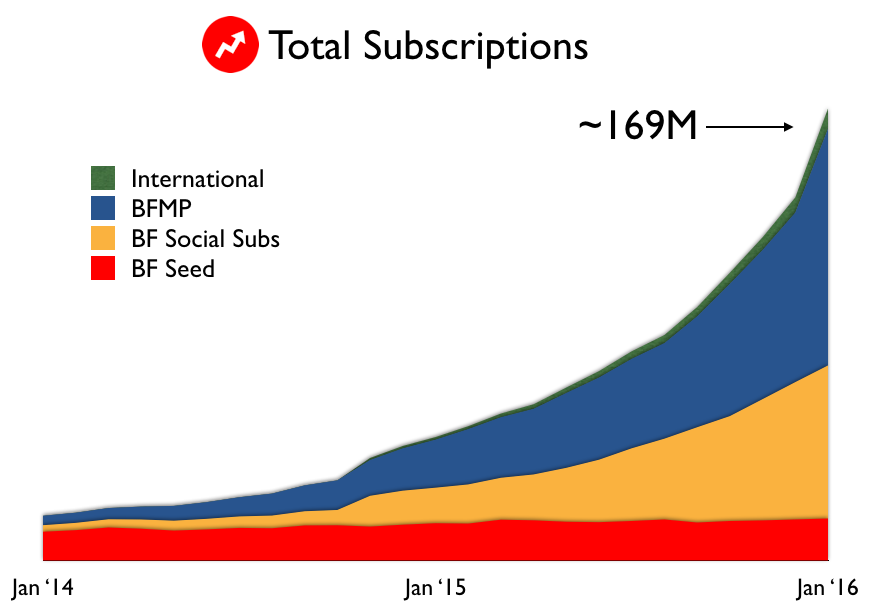
We define subscribers as people who have taken an action to show an interest in the BuzzFeed brand, such as people who use our mobile apps, sign up for our newsletters, visit our homepage, or follow our social feeds. This helps us understand different affinities and how they are growing.
Lastly, we are starting to look at engagements, defined as shares, hearts, comments, likes, repins, etc., on all the platforms. In the past we avoided using this metric, because we felt that the share data provided by Facebook about articles was too unreliable. But the number of Facebook shares of articles, while still very large, represents a smaller and smaller portion of our total engagements, so now we will start examining this (re-anchoring FTW!).
The reason we care about data is that we hope to learn something from it.
3. Be humble: Data is best used for learning, not vanity
Now that I’ve shown some really big numbers about BuzzFeed’s reach, I’ll recommend that we don’t get too high on ourselves. Knowing our top-line numbers is useful for understanding large trends and for bragging (yes, we do brag!), but it doesn’t help us make better content or connect with our audiences. Ultimately, the reason we care about data is that we hope to learn something from it. We should look to other, smaller numbers for that.
4. Be pragmatic: Look at the metric(s) that helps you learn about your platform or achieve your objectives
Knowing what you’re trying to do or learn is the first step in figuring out what metrics to look at. (In business speak, I would say: Identify your KPIs in advance.) We don’t use the same metrics for success on all platforms. We don’t use the same metrics for success for all kinds of videos. We don’t use the same metrics for success for all kinds of articles, or for all of our Facebook pages. It would be easier if we did! But we are trying to learn and achieve different things with each platform and video/post type. The same is true with our advertisers. Each advertiser has its particular goals (e.g., maybe one is more interested in scale while another is more interested in DR), and metrics should reflect that.
This sounds like it’s complicated and messy, and it is! (See No. 2.) But it’s pragmatic. For example, for certain kinds of videos we look at views on YouTube but shares on Facebook. We found that different metrics were clearer signals on these different platforms.
5. Be human: Some kinds of impact are not quantifiable
We define “impact” as changing something in the real world, on a personal or institutional level. Some recent examples we are proud of:
- A Texas woman who was sentenced to 45 years in prison for failing to protect her son from her abusive boyfriend, even though she tried to stop the beating, was granted parole after being featured in a 2014 BuzzFeed News investigation.
- The U.N. Human Rights office and the NYC Human Resources Administration (the largest social services agency in the country) included our video "What It’s Like to Be Intersex" in its LGBTQI trainings.
- Our Snapchat edition dedicated to Muslim identity touched a lot of people. We received lots of tweets and this email: “I'm a Muslim girl living in Australia facing the hardship of trying to explain my religion to my friends and colleagues almost every day and I always get called brainwashed for following my religion. Clicking on BuzzFeed today and seeing a whole series dedicated to Muslims... Words can't start to explain how much that meant to me.”
We can measure some kinds of impact, and we do it regularly for our advertisers, especially since they have clear objectives (see No. 4). But some kinds of impact are not quantifiable in the sense they you can’t say that one instance is larger than another. And trying to do so diminishes our ability to make a difference and connect with people.
In conclusion….
Come work for our data team; we're looking for inquisitive, talented leaders!
Metrics should reflect what a company cares about, and so each media company has to choose its own data points that matter. Even now, as BuzzFeed adopts a “global cross-platform” strategy, we are dreaming up new ways to understand and learn from data. What if we could calculate a cross-platform lift for each piece of content or each content frame? What if we could predict the ROI of translating a piece of content into a particular language? What if we could do the same for advertisers? It’s an exciting time! We are pumped! (BRB, we probably need to re-anchor again right now.)
P.S. Come work for our data team; we’re looking for inquisitive, talented leaders! Contact me at dao at buzzfeed dot com.