

On Monday, Uber released a report on driver earnings, conducted by the company's head of economic research Jonathan Hall and Princeton economist Alan Krueger. Hall and Krueger used data from a diverse group of drivers in 20 markets. They found that the majority of Uber drivers drive 15 hours or fewer per week, and that the average Uber driver earns an average wage of $18.75 an hour, before expenses.
(Krueger was previously a paid consultant for Uber, but the company says he was not paid for his work on this study.)

Uber released a survey of driver earnings in 2015; this new report is an update of that survey, revised to include estimations of driver expenses — how much drivers spend on gas, car maintenance, insurance, and taxes. It also looks at whether the amount of time drivers spend working per week influences their hourly earnings, and how driver earnings change over time, especially following price cuts.
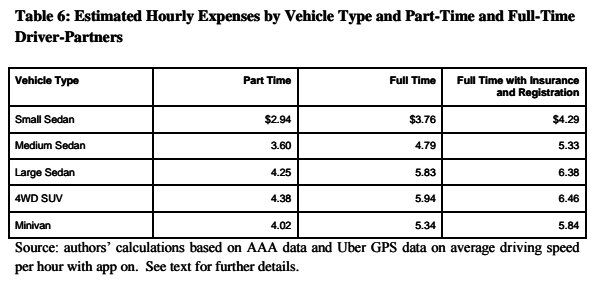
According to the report, which used data from AAA, a full-time Uber driver driving a small sedan would have about $3.76 in expenses per hour, while the same person driving an SUV with four-wheel drive would have expenses of around $5.94 per hour. These conclusions about driver expenses are similar to those made in a June BuzzFeed News investigation, which found that in late 2015 in three cities, working for Uber cost drivers $3.50 to $5 an hour, and which didn't take car size or full-time versus part-time into account. However, this report doesn't take geographical location into account, which is important because the amount of rain or snow a vehicle experiences can impact the cost of maintaining it.
Despite the fact that Uber was able to estimate driver expenses for the first time in this report, its authors chose not to publish estimates of driver net earnings, instead publishing estimates of drivers' earnings before expenses.
However, it's possible to draw an illustrative hypothetical using Uber's estimations. For example, a part-time driver of a minivan in Chicago earning an average $15.48 an hour would, based on Uber's model, incur $4.02 an hour in expenses, for a net hourly earning of roughly $11.46 an hour. A full-time driver in Washington, DC, earning an average $18.21 an hour driving a four-wheel-drive SUV would have expenses of around $5.94 per hour, for net hourly earnings of $12.27.
In June, BuzzFeed News found that Uber drivers in late 2015 earned approximately $13.17 per hour after expenses in Denver, $10.75 per hour after expenses in Houston, and $8.77 in Detroit.
It's interesting to note that while the report does look at how driver earnings change over time, it doesn't look at how driver expenses change over time. Specifically, the report addresses the issue of fare cuts and driver utilization, and ultimately supports Uber's argument that even when customers are paying more, lower prices increase demand, meaning drivers' earnings remain stable.
While that may be true — and Uber's data suggests it is — it doesn't take into account the fact that a driver's expenses will increase as he or she is driving more. So, although the report does measure the rise and fall of driver earnings as prices fall and demand increases, it doesn't measure the impacts of that increase in demand on how much a driver is spending.