Five Surprising Charts About The 2012 Election

The FEC has released a summary of the money raised and spent in the first 18 months of the election. $4 billion in five graphs.

I know, right? Now tell your friends!
Five Surprising Charts About The 2012 Elec...
Ruby Cramer

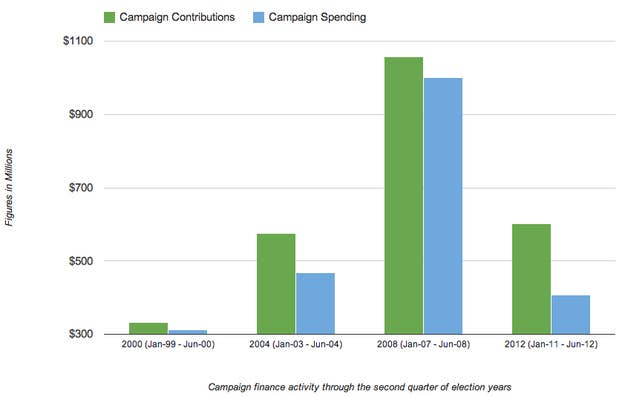
The first 18 months of 2004 and 2008 were actually more expensive than 2012

Although 2012 is forecast to be this country’s most costly election yet, presidential candidates spent more money through the second quarter in 2008 and 2004 — also an election with a sitting president — than they did in 2012. In total, presidential candidates raised $601.9 million and spent $407.9 million from January 1, 2011 through June 30, 2012. Via: fec.gov

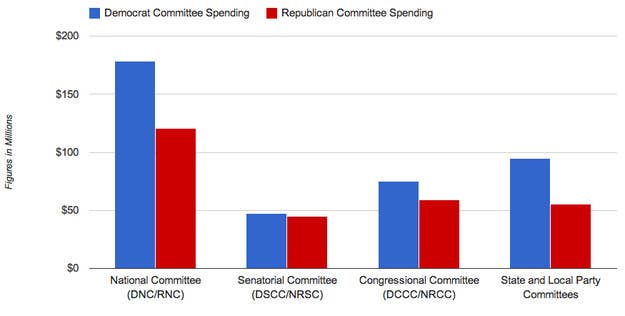
Democratic party committees out-spent Republicans by significant margin

Through the second quarter, the Democratic National Committee spent $178.4 million — nearly $58 million more than the Republican National Committee. In total, national, state and local political party committees reported disbursements of $626.3 million during that 18-month period. Via: fec.gov

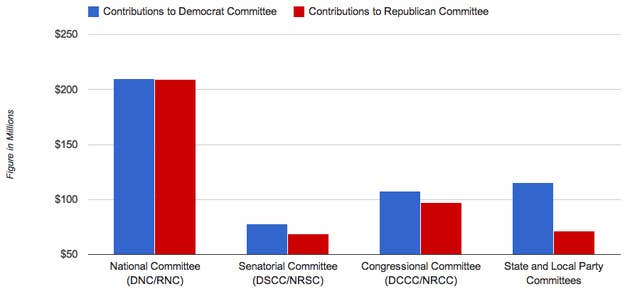
The DNC, DSCC, and DCCC also out-fundraised Republican party counterparts

The Democratic National Committee and Republican National Committee raised almost identical amounts in the first 18 months of the election — the DNC out-raised the RNC by just $400,000. The Democratic Senatorial Campaign Committee (DSCC) and Democratic Congressional Campaign Committee (DCCC) also out-raised their Republican counterparts. Via: fec.gov

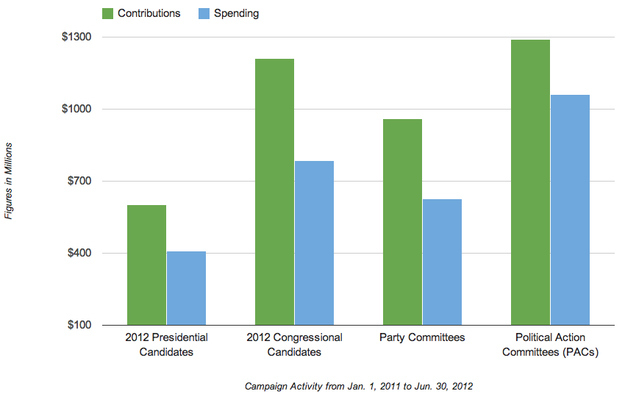
Congressional candidates raised and spent money at record levels in 2012

With over 1,800 candidates running for the House and Senate this year, congressional candidates raised and spent a record amount of money in the first 18 months of the election. Campaign fundraising for congressional races has doubled over the last ten years — candidates for the House and Senate raised more than $1.2 billion and spent more than $786.8 million. Via: fec.gov

PACs raised and spent the most money in first 18 months of the election

In the first 18 months of the 2011-2012 election cycle — from Jan. 1, 2011 to Jun. 30, 2012 — a total of $4 billion was raised by presidential and congressional candidates, political parties, and political action committees. Nearly $2.9 billion has been spent. PACs have been the greatest source of income and spending during this campaign. Via: fec.gov

Check out more articles on BuzzFeed.com!

More ▾

Facebook Conversations


    Responses So Far

    • J H thinks Five Surprising Charts About The 2012... is OMG  about 7 months ago
    • Five Surprising Charts About The 2012... is starting to get hot on Facebook Share It  about 7 months ago
    • newsfeed.time.com readers just made Five Surprising Charts About The 2012... hotter  about 7 months ago
    • elle438   Five Surprising Charts About The 2012...  about 7 months ago
    • chuyb thinks Five Surprising Charts About The 2012... is Fail  about 7 months ago
    • CamB82   Five Surprising Charts About The 2012...  about 7 months ago
    • aabgar thinks Five Surprising Charts About The 2012... is Fail  about 7 months ago
    • MattHurst thinks Five Surprising Charts About The 2012... is Geeky  about 7 months ago
    • Five Surprising Charts About The 2012... is starting to get hot on Twitter Tweet It  about 7 months ago
    • Ben Nicoara   Five Surprising Charts About The 2012...  about 7 months ago
    Now Buzzing