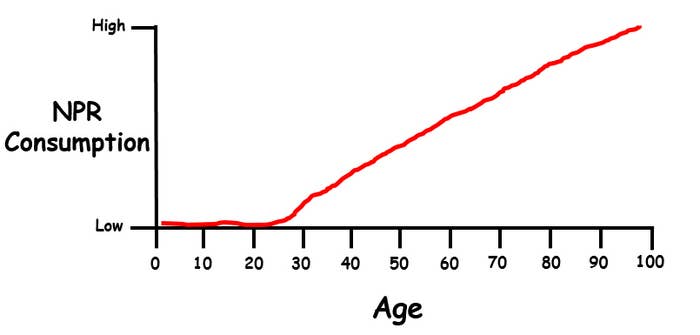
During the drive home from work, I recently found myself listening to NPR. On the program "All Things Considered," the host talked about President Obama's big speech on the National Security Agency, in which the president, in a nutshell, said he will reform the NSA but not stop its collection of metadata.
I pulled into my driveway, clicked off the radio and thought, "Ya know, I feel like I've been listening to NPR more now than I used to, which was basically zero." I did just turn 30 (and already miss these 20 things about my 20s) and realize my consumption of NPR and talk radio, in general, is slowly but steadily increasing with age.
If I had to predict my relationship with talk radio over the long haul, here's my best guess:
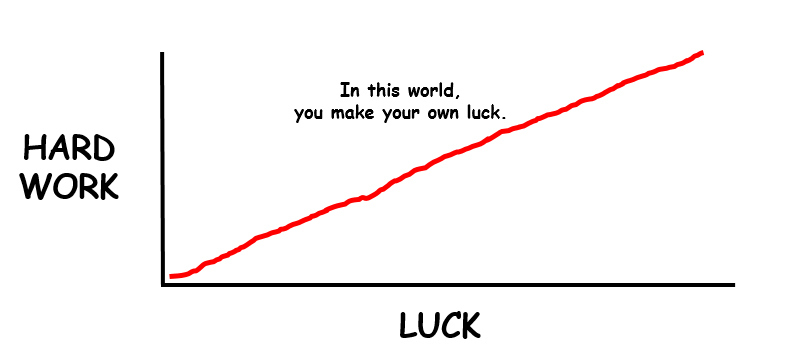
Come to think of it, we can describe much of our lives in simple line graphs.
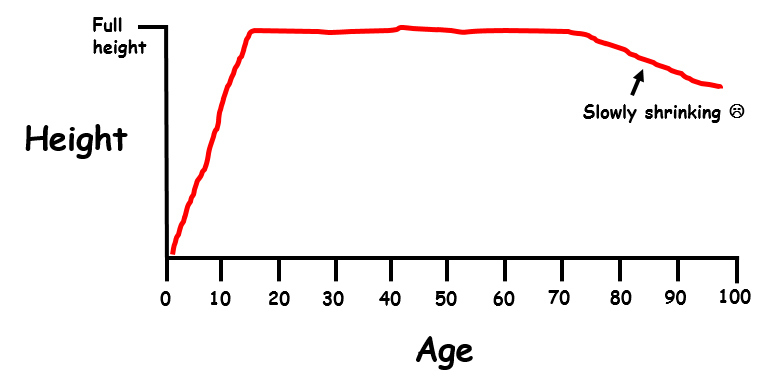
For example, our height:
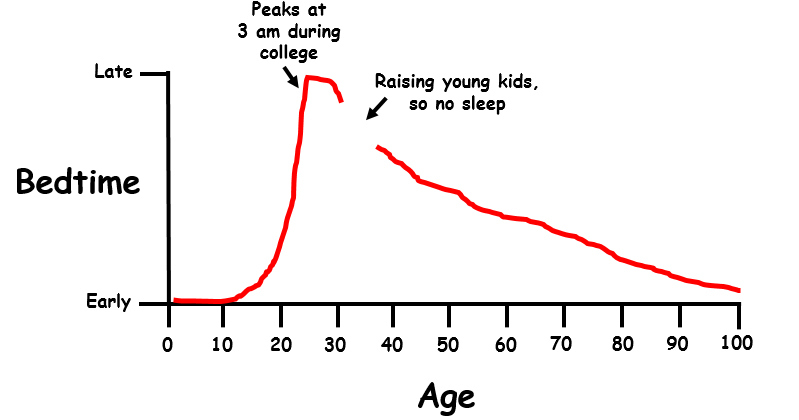
And when we fall asleep:
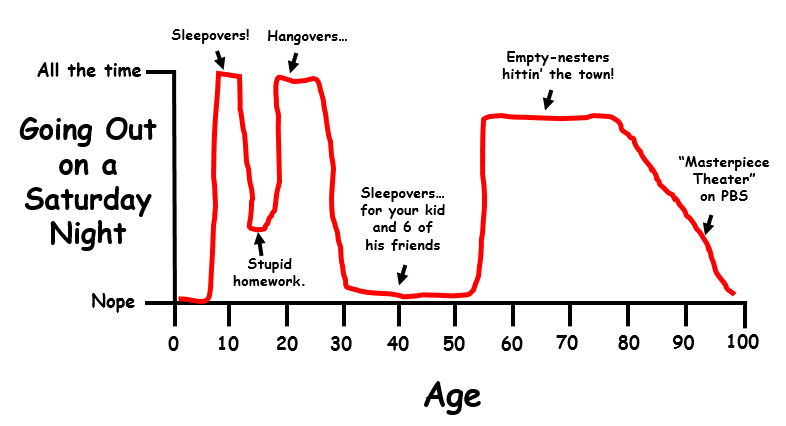
Which means this line graph is all over the place:
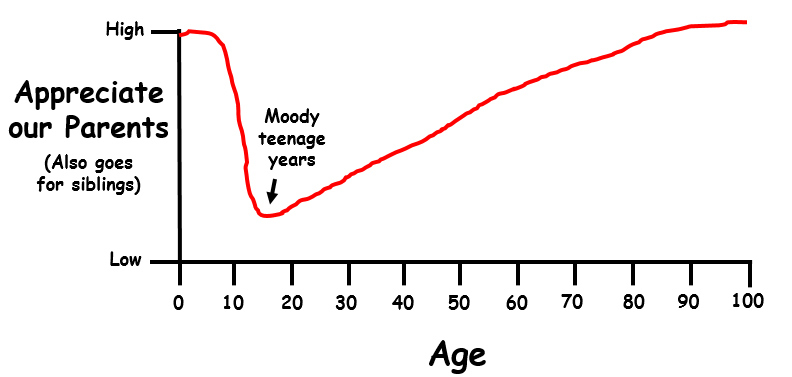
At least family life remains consistent (after our teens):
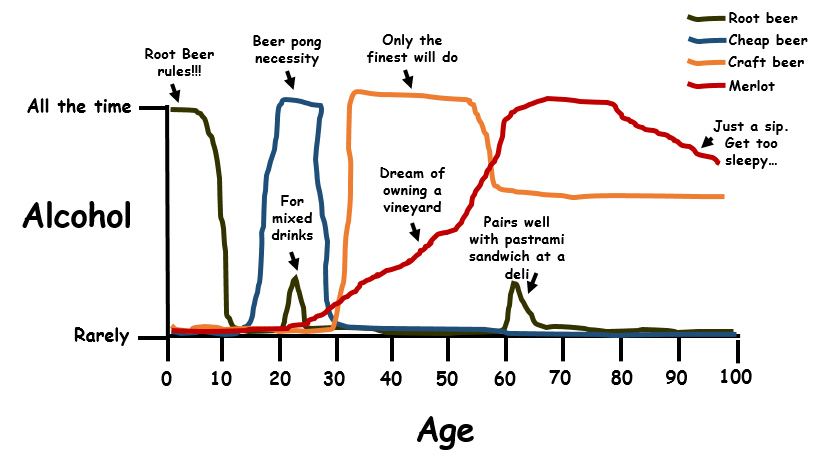
When it comes to drinking, the line graph gets a little more colorful:
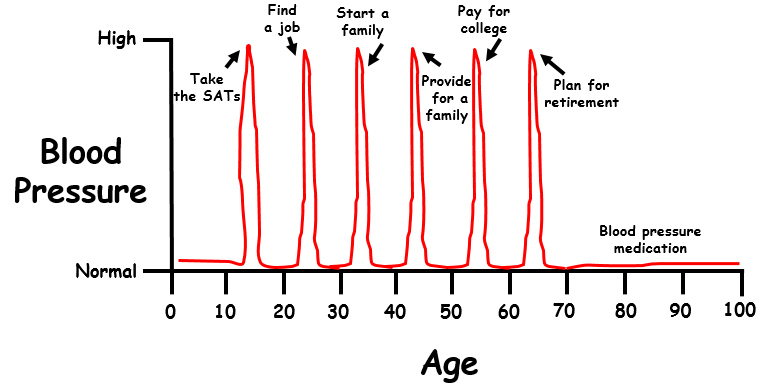
And when we examine our blood pressure over the years, it's spike after spike:
Plus, our careers also take a toll:

That's why, when life gets too crazy, we need to curl up with a sure thing:

Children's programming always lightens the mood too:

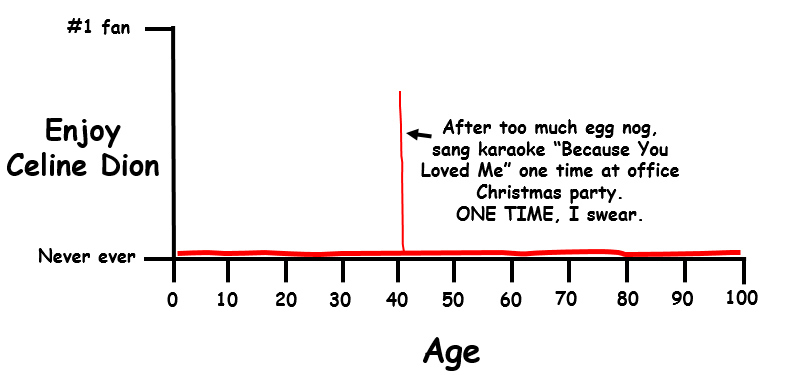
Even at our lowest, may we never do this (except once):
Still, plenty of life's greatest truths have no timeline at all.
What's true happiness?

Let's try again.

Still following this blog post? Remarkable!

Visit my blog, News To Live By, which highlights the career advice "hidden" in the day's top stories.
Trust me. It's super productive.
Share This Article