
The Electoral College system gives more voting power to some races over others.
The average white non-Hispanic voter could have nearly two times the influence on this election than the average Asian voter, according to a BuzzFeed News analysis. Why? Geography. The high concentration of Asian voters in certain “safe” states, ones that are almost certain to break for one party or another, means that they have less influence on the ultimate outcome of the election.
We conducted an analysis of the relative strength of each registered voter by race by combining data from the U.S. Census’s Voting and Registration data by state and race with FiveThirtyEight’s “Voter Power Index.”
It’s important to note that this analysis does not account for who actually voted, only who was registered in 2012. Also, the demographics of each state have likely shifted in the four years since. Still, this analysis shows the outsized influence that certain demographics have on the electoral process.
BuzzFeed News also analyzed other dimensions, such as gender, education, and income, but the differences were not as significant as just looking at race alone. Even though much has been made about Donald Trump’s white, non–college educated base, this analysis suggests that those voters will not have any more of an impact on the election than the typical white voter.
According to FiveThirtyEight, “The ‘Voter Power Index’ is the relative likelihood that an individual voter in a state will determine the Electoral College winner.” Swing states that could potentially tip the election (such as New Hampshire, Nevada, Colorado, North Carolina, and Michigan) have high “Voter Power Index” scores, whereas states with large Democratic or Republican majorities (such as Wyoming, West Virginia, Oklahoma, Maryland and Massachusetts), are at the other end of the scale.
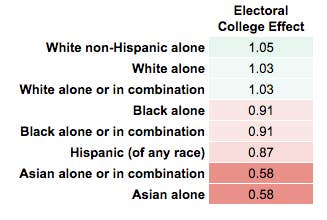
Our analysis found that every registered white non-Hispanic voter in 2012 has the influence of about 1.05 registered voters. For registered Asian voters it was just 0.58, and for Hispanics it was 0.87.
In 2012 registered Asian voters were concentrated in “safe” states such as New York, California, Texas, New Jersey, and Illinois, all of which are not projected to have a big influence on the 2016 election.